Browse categories
Explore
Fiverr Pro
English
$
USD


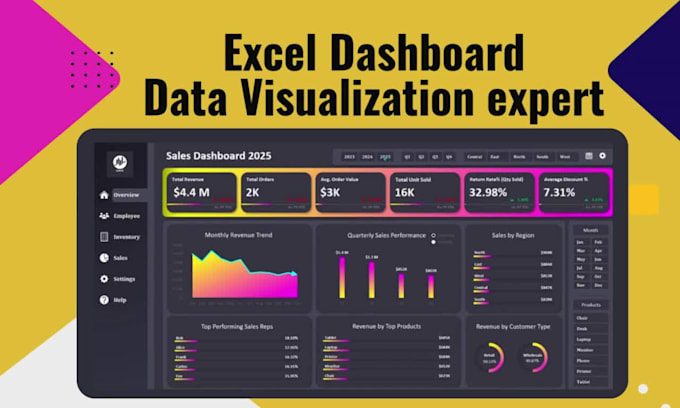
I will create interactive, user-friendly Excel dashboards that turn your raw data into clear, actionable business insights. Perfect for Sales, Finance, Marketing, HR, or Operations, my dashboards help you track KPIs, revenue trends, top products, and performance metrics at a glance.
Your dashboard can include:
Dashboards are modern, professional, and easy to maintain, even without advanced Excel skills.
What Youll Get:
Interactive KPI dashboard
Professional charts & visual insights
Power Query data cleaning & refresh
Power Pivot model (if needed)
Optional VBA automation
Easy-to-update file + consistent formatting
My Process:
Send your data today, and lets turn it into a clean, interactive Excel dashboard that highlights key insights and helps you make faster, smarter business decisions.
Excel Expert Dashboards Power Query and VBA Automation Specialist
Languages
1. What do you need from me to start the project?
I’ll need your raw data file (Excel, CSV, or Google Sheet) and a short brief on what you want to track — such as your key KPIs or business metrics. Don’t worry if your data isn’t clean yet; I’ll use Power Query to organize and transform it before building your Excel Dashboard.
2. Can you automate reports to refresh data automatically?
Yes! I can automate your dashboard using Power Query, VBA, or DAX formulas, depending on the structure. Once set up, your KPI Dashboard updates automatically with just one click — saving you time and ensuring accuracy.
3. I’m not familiar with Business Intelligence tools. Will your report be easy to use?
Absolutely. My goal is to make every Data Visualization and Pivot Table intuitive. You’ll have interactive slicers, filters, and a clear layout that allows anyone on your team to use the dashboard — no technical background needed.
4.Can you combine multiple sheets or files into one dashboard?
Yes, I can merge multiple data sources using Power Pivot and Power Query, even if they’re from different departments or file types. This creates a single, unified Business Intelligence (BI) view of your entire operation.
5. How do you ensure the dashboard runs fast and doesn’t lag?
I design every report with scalability in mind — using optimized formulas, clean Pivot Tables, and lightweight visuals. This ensures your Excel Dashboard remains smooth, even with thousands of records. The result is a high-performance BI solution that loads fast and stays reliable.