Browse categories
Explore
Fiverr Pro
English
$
USD



I build interactive Python data dashboards that transform raw data into clean, easy-to-read visuals using Streamlit and Plotly under the hood
your data is sitting in spreadsheets, but you don't have time to dig through it for answers. That's the exact problem this Streamlit dashboard solves.
I turn your raw data into a clean, interactive dashboard so you can see your numbers, filter them, and spot trends in seconds instead of hours.
What you get:
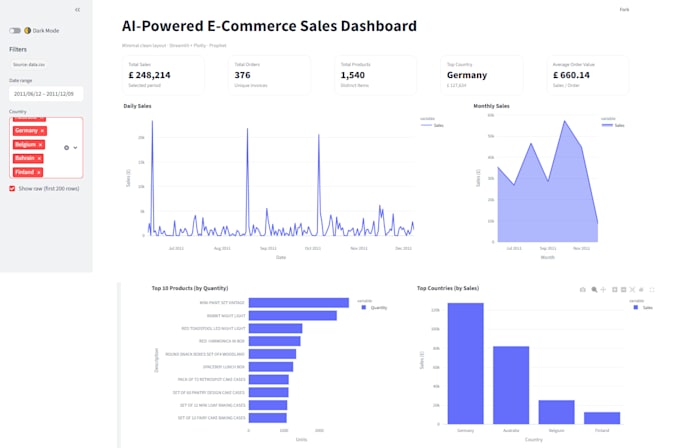
- Interactive charts (bar, line, pie, heatmap, and more)
- Filters and search so you can explore your own data
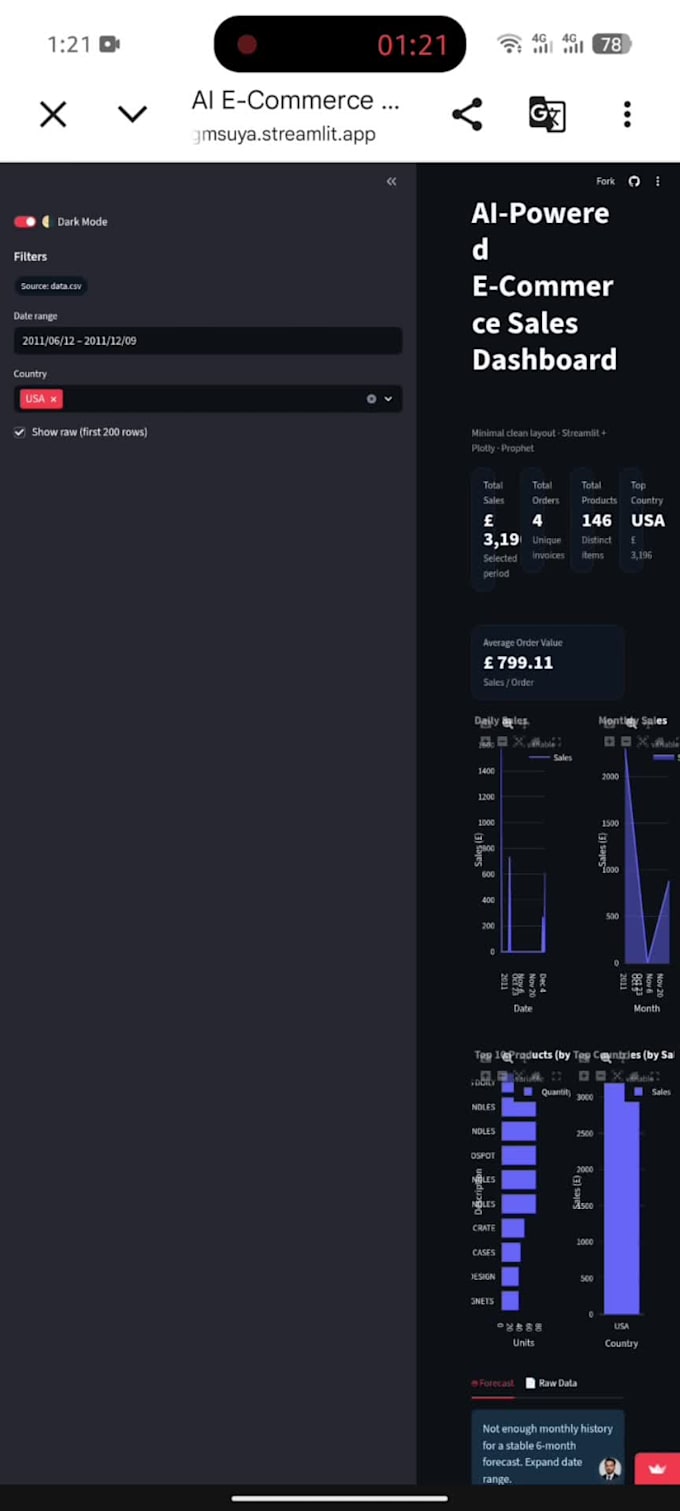
- Live KPI cards showing your key numbers at a glance
- Connection to CSV, Excel, Google Sheets, or a live database
- A shareable link so anyone on your team can open it
I'm a Data Science graduate and I run my own data agency, Cognicore Data Labs, where I build these kinds of tools for e-commerce, healthcare, and business clients. So you're not just getting charts you're getting someone who understands what the numbers actually mean.
Every order comes with a free bug-fix window after delivery, so there's no risk on your end.
Send me your data and what you're trying to track, and I'll tell you exactly which package fits best
Data Scientist, AI and Machine Learning Specialist, Data Analyst
Languages
What kind of data can you build a dashboard from?
Any structured data — CSV, Excel, Google Sheets, or a live SQL database. Sales numbers, customer data, marketing stats, healthcare records — if it's organized, I can turn it into a dashboard.
Will my dashboard be interactive, or just pictures of charts?
Fully interactive. You'll be able to filter by date, category, or search terms, and every chart updates live — this isn't a static image, it's a working tool.
Is my data safe with you?
Yes. I only use your data for the project, I'm happy to sign an NDA, and I delete your files after delivery if you ask me to.
Can you connect the dashboard to a live database or API?
Yes — I can connect to MySQL, PostgreSQL, or REST APIs so your dashboard stays up to date automatically instead of needing manual updates.
Can you add predictions, not just charts of past data?
Yes, in the Premium package I add a machine learning model that forecasts trends — like predicting next month's sales instead of just showing last month's.
What happens if I find a bug after you deliver?
You get a free bug-fix window after delivery (7 or 14 days depending on your package) — no extra charge.
Do I need to know how to code to use my dashboard?
No. Once it's built, you just click and explore — filters, dropdowns, and charts update on their own. No technical skill needed to use it.