Browse categories
Explore
Fiverr Pro
English
$
USD


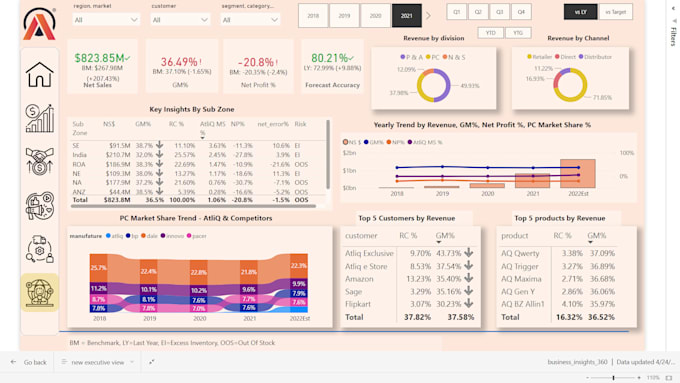
I specialize in creating interactive Power BI dashboards and visual reports that bring your data to life. With 5 years of data analytics experience, I will transform your raw data into an insightful dashboard tailored to your needs. Expect a user-friendly Power BI report with eye-catching charts, slicers, and key metric cards, all organized in a professional layout. My priority is understanding your goals: I will collaborate to include the metrics and visuals that matter most for your business. Deliverables are high-quality and customizable, with fast turnaround and unlimited revisions to ensure you're completely happy.
In my Power BI service, I can:
Whether you need a sales dashboard, performance report, or any custom visualization, Ill provide a Power BI file that makes complex data easy to understand and share.
Excel and Power BI Expert , Data Cleaning Automate Dashboards
Languages
What kind of data sources can you use?
I can work with Excel, CSV, SQL databases, or other data sources compatible with Power BI. Just share the data or access details you have, and I’ll handle the rest.
How will I receive the dashboard?
You will get a Power BI Desktop (.pbix) file, ready to use and modify. I can also provide a PDF or image snapshots of the dashboard pages if needed.
Can I update the dashboard myself later?
Yes. The final .pbix file will be fully editable. I’ll include documentation for any complex calculations and can guide you on refreshing data and updating visuals.
How interactive will the dashboard be?
The dashboard will have interactive features like filters, slicers, and drill-downs as per your requirements. You can click on visuals to filter data and get deeper insights.