Browse categories
Explore
Fiverr Pro
English
$
USD
Power BI Sales Dashboard Expert Python Cleaning
Need a clear view of your Shopify inventory, sales, and profit?
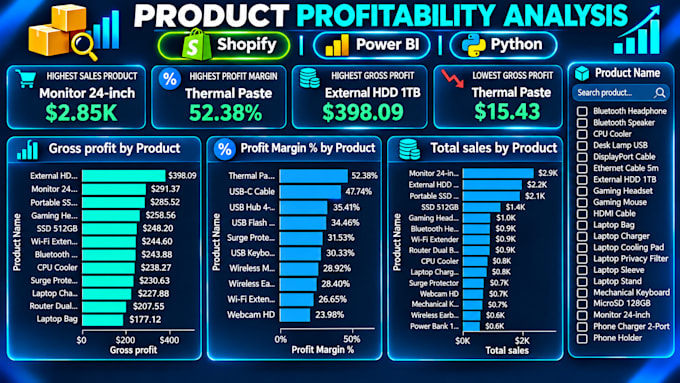
I will build an interactive Power BI inventory dashboard from your Shopify, Excel, or CSV data. I clean your data with Python first, so every number you see is accurate.
WHAT YOU GET
Inventory tracking: stock levels, inventory value, low stock items
Sales analysis: revenue and top-selling products
Profit analysis: margins by product and category
KPI cards, interactive charts, filters and slicers
Data cleaning with Python: duplicates, missing values, wrong formats
PBIX file + PDF preview
WHAT I NEED FROM YOU
Your Shopify export, Excel, or CSV file
1-2 questions you want answered (example: which products are overstocked?)
WHY ORDER FROM ME
Fast delivery, starting from 2 days
Clean, simple design that non-technical business owners understand
Clear communication at every step
Not sure which package fits? Message me before ordering and I will review your data and recommend the right option.

What data do you need to start?
I need your Excel or CSV file with relevant sales, product, cost, and inventory data. I will review the dataset and confirm any data cleaning required before starting.
Will you provide the source file (PBIX)?
Yes, the editable Power BI (.pbix) file is included. A PDF export is provided when included in your selected package.
Can you convert my existing Excel dashboard to Power BI?
Yes, I can convert suitable Excel reports into an interactive Power BI dashboard. Please share a sample first so I can confirm the scope.
Do you add company logos and custom colors?
Yes, I can use your company logo and brand colors if you provide them and the customization fits your selected package.
Can you clean inventory data using Python Pandas?
Yes, I can help clean duplicates, missing values, and inconsistent data using Python Pandas. Please share a sample dataset to confirm the scope and price.
Can your dashboard show stock levels, reorder points, and profit margins?
Yes, if your dataset contains the required fields, I can create visuals for stock levels, reorder points, sales, and profit margins according to your selected package.