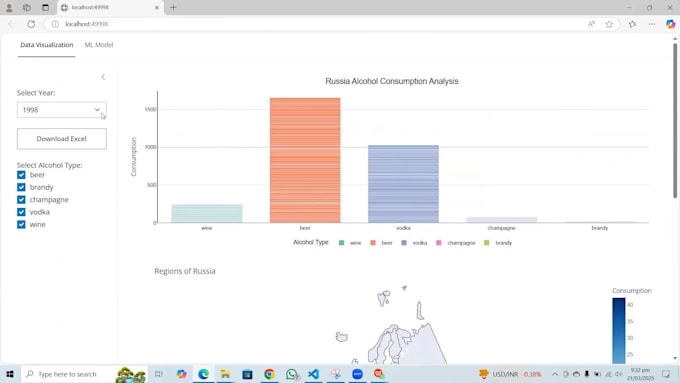
I will design Shiny R Dashboard to analyze data for reports.
You will receive interactive shiny dashboard of the data.
There will be download option to save files and charts.
The design will be user friendly and eye catchy.
Tool
Shiny
Chart type
Distribution
Location
Patterns
Time series
Heat map
Histogram
Performance
Get to know Devannand
Devannand
Data Scientist
5.0(8)
FromPakistan
Member sinceJun 2024
Avg. response time3 hours
Last delivery1 month
Languages
English, German
Need data-driven solutions that deliver real results?
I transform your raw data into actionable insights using Python, AI, ML, and advanced analytics. Whether you need predictive models, business intelligence dashboards and comprehensive data analysis. With 3+ years of experience, I deliver solutions tailored to your unique challenges.
What you get:
✓ Clear visualizations that inform better decisions
✓ Custom AI/ML solutions for your business problems
✓ Thorough analysis with actionable recommendations
Ready to unlock your data's potential? Let's Connect.