Browse categories
Explore
Fiverr Pro
English
$
USD
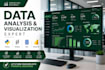
From Python-based exploratory analysis to interactive PowerBI dashboards, I provide high-end analytical solutions that help you make smarter, data-driven decisions.
WHAT I OFFER: Data Cleaning & Preprocessing: Transforming messy data into a clean, ready-to-use format.
Exploratory Data Analysis (EDA): Uncovering hidden trends and patterns.
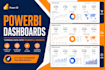
Advanced Visualization: Stunning, interactive dashboards (PowerBI/Tableau/Seaborn). Predictive Modeling: Using Machine Learning to forecast future trends.
️MY TECH STACK:
Languages: Python (Pandas, NumPy, Scikit-Learn), SQL.
Tools: PowerBI, Excel, Jupyter Notebooks.
Viz Libraries: Matplotlib, Seaborn.
How do you handle data privacy and security?
I take data privacy very seriously. I only use your data for the agreed analysis and never share it with third parties. Once the project is completed and approved, I can permanently delete all copies of your data from my local system upon request.
What formats do I need to provide my data in?
I can work with almost any format, including CSV, Excel (.xlsx, .xls), JSON, and SQL databases. If your data is in a specific software or a PDF, please message me first so I can confirm the extraction process.
Which tools will you use for the analysis?
I primarily use Python (Pandas, NumPy, Matplotlib, Seaborn) for deep analysis and Power BI for interactive dashboards. I also use SQL for database querying and Excel for simpler reporting tasks.
Will you provide a written report with the charts?
Yes! I don't just provide charts; I provide a comprehensive summary of my findings. This includes an explanation of the trends I discovered and actionable business recommendations based on the data.
Can you handle large datasets?
Yes. Using Python and optimized SQL queries, I can efficiently process and analyze large datasets that exceed the limits of standard spreadsheet software like Excel.


