Browse categories
Explore
Fiverr Pro
English
$
USD
Your Go To Coder for Small Python Projects!!
Hello! Im Dheeraj Shahi, a passionate Python programmer specialized in data visualization and dashboard creation. I help transform raw or unorganized data into clean, meaningful, and visually appealing insights.
Using Python libraries like Matplotlib, Seaborn, and Plotly, I create stunning charts, graphs, and interactive dashboards to make your data tell a story. Whether you have a small dataset or a large file, I ensure accurate, well-structured, and professional visualizations that simplify complex information.
What I Offer:
Data visualization from CSV/Excel files
Custom dashboards and performance reports
Cleaning, organizing, and automating data workflows
Trend and insight identification for better decision-making
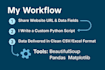
️ Tools: Python, Pandas, Matplotlib, Seaborn, Plotly, Jupyter Notebook, Google Colab
Why Choose Me:
Fast delivery, 100% accuracy, clear communication, and visually rich dashboards tailored to your goals.
Lets bring your data to life share your dataset and get a stunning dashboard today!


Q1: What type of data do you accept for visualization?
A1: I accept CSV, Excel, or Google Sheets files. You can also share raw data from APIs or databases. I’ll clean, organize, and prepare it for visualization.
Q2: Which tools or libraries will you use for my dashboard?
A2: I mainly use Python with Pandas, Matplotlib, Seaborn, and Plotly. For notebook-based reports, I use Jupyter Notebook or Google Colab for interactive outputs.
Q3: Can you handle large datasets or complex visualizations?
A3: Absolutely! I can manage large datasets efficiently and create advanced charts, comparisons, and trend visualizations based on your requirements.