Browse categories
Explore
Fiverr Pro
English
$
USD


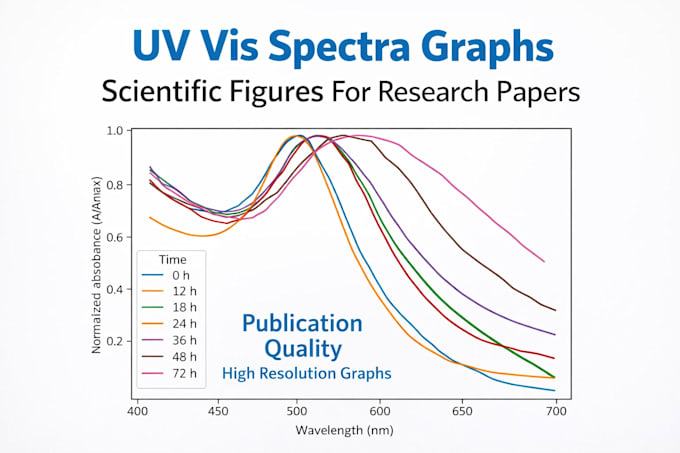
I will create professional UVVis spectra graphs and scientific figures suitable for research papers, theses, and journal publications.
This service includes the preparation of high-quality scientific graphs such as UVVis spectra, absorbancewavelength plots, spectroscopy graphs, and other research figures based on your experimental data.
All figures will be prepared with publication-quality formatting suitable for scientific journals and conference papers.
What I can create:
UVVis spectra graphs
Absorbance vs wavelength plots
Scientific graphs for research papers
Publication-ready figures for journals
Clean and professional scientific visualizations
What you will receive:
High-resolution figure (PNG or JPG)
Editable source file if required
Accurate scientific formatting
Fast and reliable delivery
Please provide your data (Excel, CSV, or text format) and any specific formatting requirements before placing the order.
Please inform the freelancer of any preferences or concerns regarding the use of AI tools in the completion and/or delivery of your order.
Electrochemical Sensors
Languages
What data format should I provide?
You can provide your experimental data in Excel, CSV, or text format. I will use your data to generate accurate UV Vis spectra or scientific graphs.
Will the figures be suitable for journal publication?
Yes. All graphs will be prepared in high resolution and formatted according to scientific publication standards suitable for research papers and journals.
Can you create graphs from raw experimental data?
Yes. I can generate UV Vis spectra, absorbance wavelength plots, and other scientific graphs directly from your raw experimental data.