Browse categories
Explore
Fiverr Pro
English
$
USD

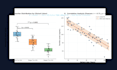

Are your scientific figures holding back your paper or presentation?
Journals (Elsevier, Springer, Nature, PLOS) often reject figures due to low resolution, inconsistent typography, or unreadable labels.
As a Medical Laboratory Technologist & Computational Biologist, I use R and ggplot2 to convert your raw data into peer-review-standard publication figures.
What I deliver:
Vector exports (PDF, EPS, SVG) & 300/600 DPI TIFF/PNG
Journal compliance: font sizing, axis ratios, clean margins
Statistical markings: p-values, significance brackets, error bars (SD/SEM)
Colorblind-friendly palettes (viridis, colorbrewer)
Multi-panel figures (Fig 1A, 1B, 1C)
Reproducible R source code (Standard & Premium)
Supported plot types:
Box, violin, and jitter plots
Scatter plots with regression & correlation
Bar charts with custom error bars
Heatmaps & correlation matrices
Volcano plots & survival curves
Note: I visualize legitimate empirical data. I do not fabricate data or write coursework.
Please message me before ordering to discuss your dataset and target journal!
Biomedical Data and Scientific Visualization Specialist
Languages
Can you work from rough Excel charts?
Yes. If you provide your underlying Excel data alongside your current chart, I will extract the values and recode the plot in R to achieve clean, publication-grade aesthetics.
Can you ensure the figure matches my target journal's specifications?
Yes. Simply share the author guidelines or journal name, and I will calibrate dimension limits (single vs double column width), font size, and file formats (PDF, EPS, or 300/600 DPI TIFF) accordingly.
Can you ensure the figure matches my target journal's specifications?
Answer: Yes. Simply share the author guidelines or journal name, and I will calibrate dimension limits (single vs double column width), font size, and file formats (PDF, EPS, or 300/600 DPI TIFF) accordingly.
Do you write academic theses or student assignments?
No. In accordance with Fiverr's academic integrity policies, I do not write student assignments or perform ghostwriting. I assist researchers and professionals in formatting and visualizing their own empirical data.


