Browse categories
Explore
Fiverr Pro
English
$
USD
Level 2
Has met high performance criteria and has a proven track record for meeting client expectations.
Please ask me before placing the order.
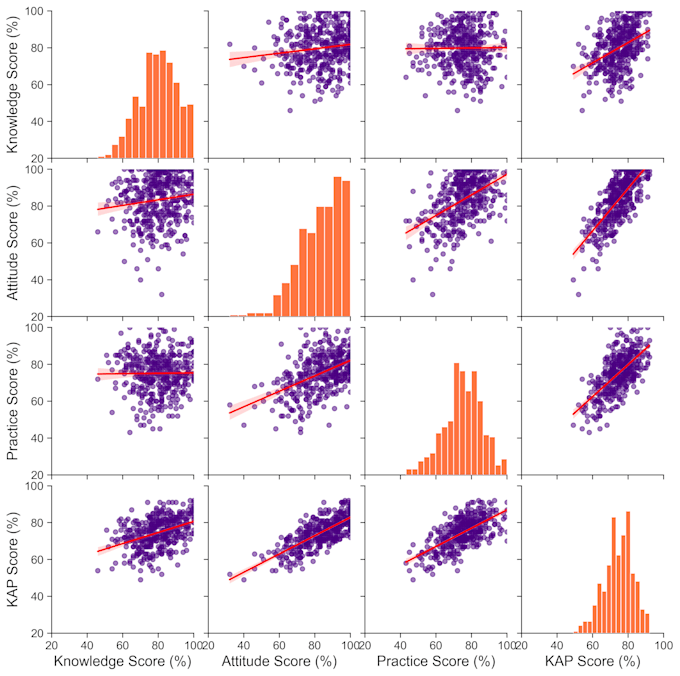
Data Analysis: I specialize in uncovering valuable insights and drawing meaningful conclusions from various types of data, whether its survey results, experimental findings, or business metrics. Using Python (Jupyter Notebook, pandas, NumPy, scikit-learn, etc.), Excel, and R, I apply advanced statistical techniques to identify patterns, correlations, and trends within complex datasets. My goal is to make data-driven decisions straightforward and impactful by providing clear and relevant interpretations.
Data Visualization: I bring your data to life through effective, engaging visualizations. Using tools like Python (matplotlib, seaborn), Excel, and R, I transform complex information into intuitive graphics, charts, and interactive visuals. This approach ensures that your findings are easy to understand and communicate, even to broader audiences. Whether for research publications or business presentations, my visualizations make your data compelling and accessible, enhancing the impact of your work.

Programming language:
Python
•
R
Technology:
Excel
•
Google Sheets
•
Jupyter Notebook
•
SPSS
Expertise:
Prediction
•
Probability
•
Statistics
•
Hypothesis testing
Tools:
Jamovi
•
RStudio
•
Google Colab