Browse categories
Explore
Fiverr Pro
English
$
USD

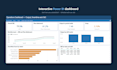
Most dashboards fail for the same reason: they show what is easy to
plot, not what the operation decides with.
I build the other kind.
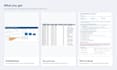
WHAT YOU GET
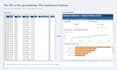
- A Power BI dashboard with the indicators your operation actually uses
- A properly modelled data layer, so the report does not slow down or
break when the data grows
- Automatic refresh from your source
- Documentation of how each indicator is calculated, so nobody argues
about the numbers in a meeting
WHY ME
I am a mechanical engineer with a Lean Six Sigma Green Belt and a Power
BI certification, and I managed operations before I automated them. I
know OEE, productivity and shift performance from the operation side,
not only from the data side.
Most Power BI freelancers can build the visual but cannot tell you
which indicator matters. I can help you choose before I build.
HOW IT WORKS
1. You tell me what decision the dashboard needs to support
2. I confirm in writing the indicators, the pages and what is out
3. I deliver, you test, and I adjust until it is right
Written scope, communication by message.
Process Automation and Power BI, Six Sigma Green Belt
Languages
What data sources do you work with?
Excel, CSV, Google Sheets, SQL databases and system exports. If your data is in a system I cannot reach, I can build the extraction too.
Do I need a Power BI licence?
For personal use, Power BI Desktop is free. Sharing with your team requires a Pro licence from Microsoft. I explain the options before you order, so there is no surprise cost.
I do not know which indicators I need. Can you help?
Yes, and this is where I add the most value. Tell me what decision you need to make and I will propose the indicators that support it.
Can you fix or improve a dashboard someone else built?
Yes. Send it over and I will tell you what can be reused and what needs rebuilding, before you order.


