Browse categories
Explore
Fiverr Pro
English
$
USD

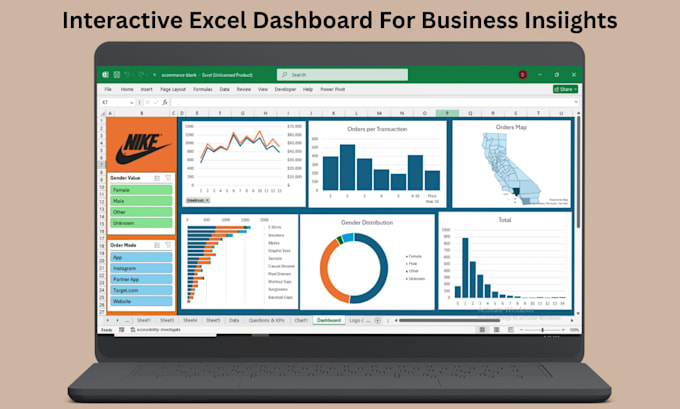
Want an interactive Excel dashboard to explore your data?
I'll design one with slicers, filters, and dynamic charts ask questions, get answers instantly.
The Problem:
Static reports lack clarity. You need to filter by region, date, or product but juggle multiple spreadsheets.
My Solution:
Interactive Excel dashboards put control in your hands. Click a slicer, see charts update. Select a region, watch KPIs change. No coding just interactivity.
What You'll Get:
My Process:
Why Me:
Guarantee: Not happy? I revise until you are. No extra fees.
Click "Continue" or message me with your requirements.
I create dynamic KPI dashboards in Excel with Power Query automation
Languages
What does “interactive” mean in your dashboards?
You can filter data by clicking slicers (e.g., region, product) or selecting date ranges with timelines. All charts and KPIs update instantly to show the selected view.
Do I need to know how to use slicers?
No. Slicers are visual buttons – just click. I’ll include a quick guide showing how to use them.
Can the dashboard handle large datasets?
Yes. I use Power Query to manage data efficiently. Dashboards work smoothly even with thousands of rows.
Do you use macros?
No. All interactivity uses built‑in Excel features (slicers, timelines, pivot charts). No security warnings, no code to break.
