Browse categories
English
$
USD
Connect to your AI

Want to know what next months sales will look like? I build forecasting and machine learning models in Python and explain the results in plain language.
What I can build:
Why work with me:
You get the forecast, charts, a short results report and clean Python code.
Message me with your data (at least 2 years of monthly data works best for forecasts) and your goal.
'Data Scientist' who Loves his work
Languages
What data do I need to provide?
An Excel or CSV file with your sales data, for example date, product, region and sales value or volume. Dummy data with the same columns is fine for a first look.
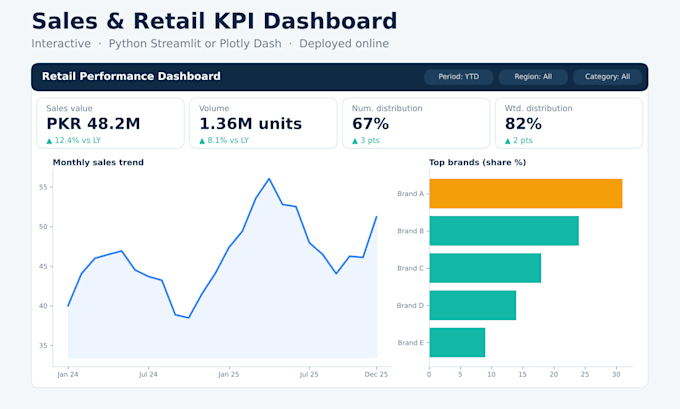
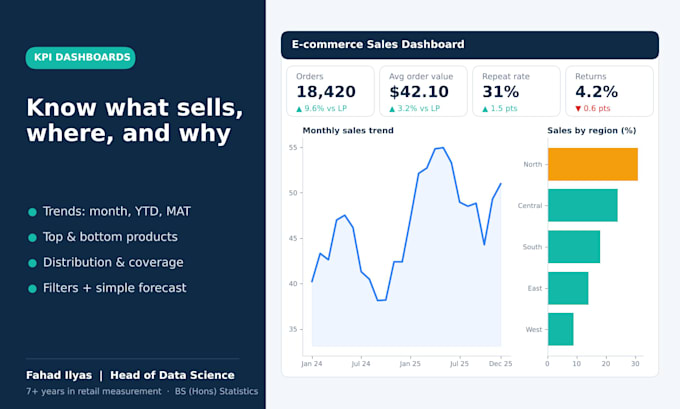
Streamlit or Dash: which should I choose?
Streamlit is quicker and simpler, which suits most businesses. Dash gives more layout control for complex dashboards. If you’re not sure, I’ll recommend one based on your needs.
Can you put the dashboard online?
Yes. The Premium package includes deployment, so you can open it from any browser with a link.
Can I update the data myself later?
Yes. I build it so you can replace the data file with a new one in the same format, and the dashboard updates automatically.
Do you build Power BI dashboards?
This gig covers Python dashboards (Streamlit and Dash). Message me if you need something else.