Browse categories
Explore
Fiverr Pro
English
$
USD
Need statistical analysis or data visualization done in R? I'm a PhD-qualified (PhD: Warwick, MPhil: Cambridge) data analyst and university instructor with years of experience using R for statistical modeling and visualization both for published research and client projects.
I'll take your raw dataset and turn it into clear results and clean visuals whether that's a simple correlation or a custom advanced model.
What I offer:
Send me your dataset and a note on what you're trying to find out I'll recommend the best approach before you even order.
How do I know which tier I need?
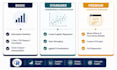
Basic covers descriptive statistics and simple tests. Standard adds regression and visualization. Premium covers advanced modeling and custom scripts. Message me your dataset and goal if you're unsure — I'll confirm the right tier before you order.
Do I need to know R myself?
No. I run everything on my end and send you the output, visuals, and interpretation. If you'd like the R script itself (to run or edit later), that's included from Standard tier up.
What kind of visualizations can you create?
Bar charts, scatter plots, boxplots, line graphs, and more — using ggplot2 for clean, high-quality output. Let me know if you have a specific style or format in mind.
Can you help with SPSS, Stata, or JASP data instead?
This gig is R-specific. I run separate gigs for SPSS/Stata and JASP/jamovi as well.
Is my data kept confidential?
Yes. Your data and results are used only for this project and not shared or reused elsewhere.
How fast can you deliver if I have a tight deadline?
Standard delivery times are listed per tier, but message me your deadline before ordering — I can often accommodate rush requests for an added fee.


