Browse categories
Explore
Fiverr Pro
English
$
USD

Level 1


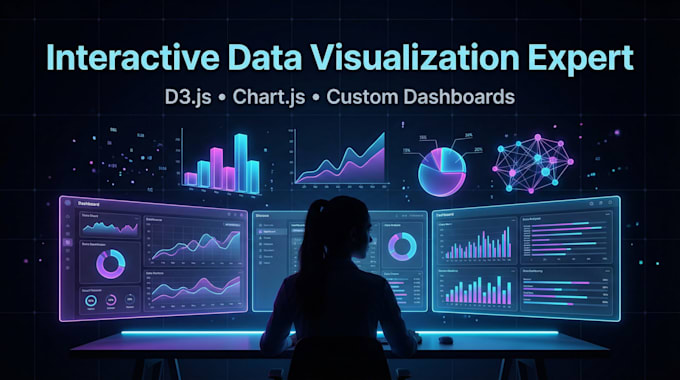
Are you looking for a modern, interactive, and professional data visualization dashboard for your website or web application?
You're in the right place.
I specialize in creating clean, responsive, and fully interactive charts and dashboards using D3.js and Chart.js.
Whether you need simple business analytics charts or complex custom data visualization, I can help you transform raw data into meaningful visual insights.
What I Can Build:
Technologies I Use:
Why Choose Me?
If you share your dataset or API, I will turn it into a beautiful and meaningful visual experience.
Please message me before placing an order to discuss your dataset and project goal
Web Designer and Developer
Level 1
Languages
Can you work with React or Next.js?
Yes, I can integrate charts into modern JS frameworks.
Do you create custom D3 visualizations?
Yes, fully custom and data-driven graphics.
Is the dashboard responsive?
Yes, fully responsive and mobile-friendly.