Browse categories
Explore
Fiverr Pro
English
$
USD
Excel Data Analyst, Data Cleaning, Analysis Dashboards
Turn your raw, messy spreadsheet data into a clean, professional Excel report or interactive dashboard.
I specialize in Excel data analysis: data cleaning, Power Query transformation, Power Pivot data modeling, DAX measures, and PivotTable/PivotChart dashboards with slicers.
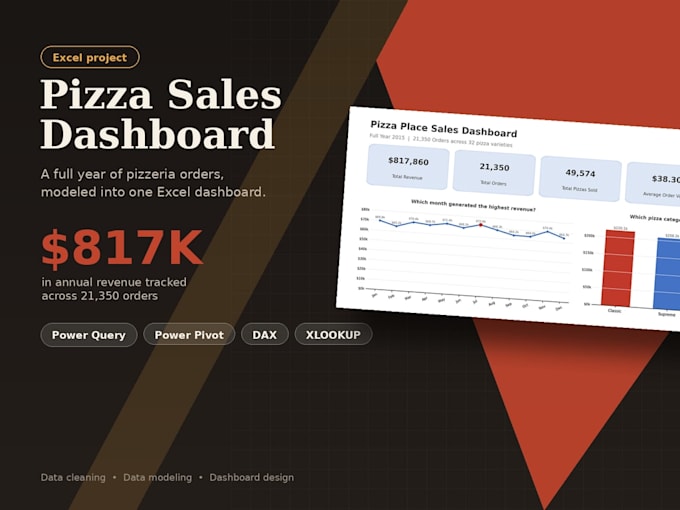
I recently built a full analytics project using 4 relational datasets (48,000+ records), enriched with XLOOKUP formulas, connected in a Power Pivot data model with custom DAX measures and an interactive dashboard the same skills I bring to your project.
3 packages to fit your needs:
I focus on clear communication, accurate work, and practical solutions, not just numbers.
Send me your data (or a sample) and your goal, and I will recommend the right package. Message me before ordering if you are unsure which one fits!


Technology:
Excel
•
Google Sheets
•
Power BI
•
Other
Analysis type:
Quantitative analysis
•
Descriptive analysis
Expertise:
Business Insights
•
Trends
•
Business intelligence
Programming language:
DAX
How much data can you handle?
Each package supports a different data size: Basic up to 10,000 rows, Standard up to 40,000 rows, and Premium up to 80,000 rows. If your file is larger, message me first and I'll confirm the right fit.
What information do you need to start?
Please share your data file (Excel or CSV), along with a short explanation of what you want to track or analyze. If you're not sure, I'm happy to guide you.
Can you work with messy or unorganized data?
Yes. Cleaning and organizing raw data is part of what I do — just send the file as-is and I'll handle the rest.
Will the dashboard update automatically if I add new data?
The Standard and Premium dashboards are built on PivotTables and a Power Pivot data model, so they update automatically once you refresh after adding new data to the source sheets.
What file format will I receive?
You'll get a working Excel file (.xlsx) with all formulas, PivotTables, and the dashboard fully functional — not a static image or PDF.
Do you use VBA or macros?
No, my work is formula- and Power Query/Power Pivot-based (no macros), which keeps the file safe to open and easy to edit without needing to enable macros.
Can I request a custom package outside these three?
Yes, message me with your requirements and I'll confirm if it fits an existing package or needs a custom offer.