I will creating publication quality figures in r from your data

F
farha_zain
F
farha_zain
Farha Z

About this gig

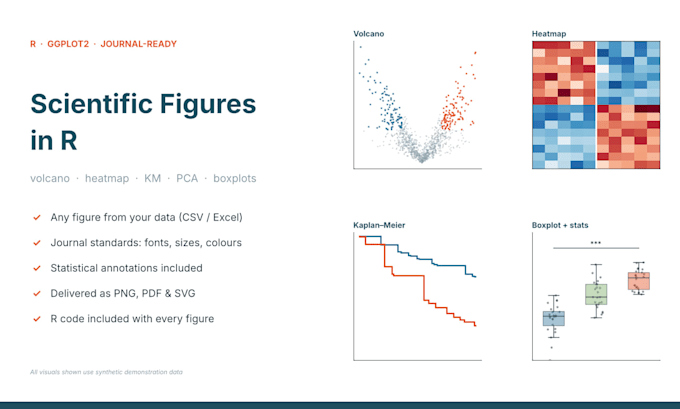
Volcano plots, heatmaps (ComplexHeatmap), PCA/UMAP, KaplanMeier curves, boxplots with statistics built in R/ggplot2 to journal standards, delivered as PNG/PDF/SVG plus the code. Send your data (CSV/Excel) and a sketch or example of what you want; I'll confirm fit before you order.

Get to know Farha Z

Farha Z

Bioinformatician, RNA seq, single cell survival analysis in R

  • FromEgypt
  • Member sinceNov 2026
  • Avg. response time1 hour
  • Languages

    Arabic, English, Spanish
I turn sequencing and clinical data into clear results and publication-quality figures. I work daily as a remote bioinformatics collaborator with European cancer research institutes: single-cell and bulk RNA-seq (QC, clustering, differential expression), survival analysis (Kaplan-Meier, Cox), targeted proteomics, and reproducible pipelines (R/Bioconductor, Nextflow, Docker). Co-author of an F1000Research report (2025). Every delivery: figures (PNG/PDF/SVG), tables, reproducible R code, and a methods summary for your manuscript. Message me first - I'll tell you honestly what fits.

My Portfolio