Browse categories
English
$
USD
Connect to your AI
Do you have Excel or CSV data but struggle to turn it into clear and useful business reports?
I will transform your raw data into a professional Excel report or interactive KPI dashboard that helps you understand your business performance.
With 5+ years of hands-on experience in retail reporting, procurement analytics, and business performance analysis, I understand how to create reports that drive real business decisions.
MY SERVICES INCLUDE:
* Sales and revenue analysis
* Retail and product performance reports
* SKU and category analysis
* Store and regional performance
* Inventory and stock reporting
* Procurement and supplier analysis
* Excel Pivot Tables and charts
* KPI dashboards and data visualization
* Data cleaning and formatting
WHAT YOU WILL RECEIVE:
* Clean and organized Excel workbook
* Professional charts and KPI indicators
* Easy-to-understand reports
* Editable Excel file
* Basic instructions for using your report
I focus on accuracy, clear presentation, and practical business insights.
Please contact me before ordering if you have a complex dataset or specific requirements.
Lets turn your data into meaningful business insights!
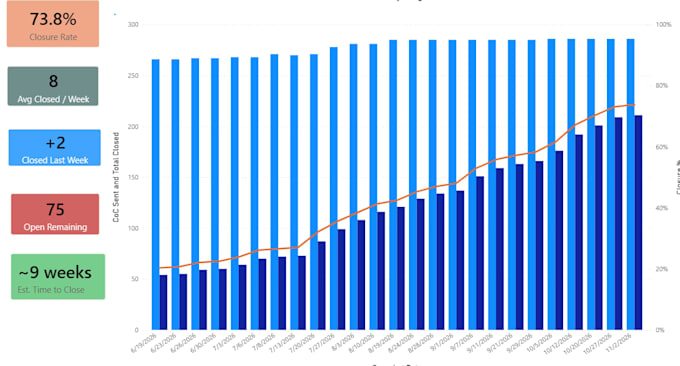
Analysis type:
Qualitative Analysis
•
Descriptive Analysis
Technology:
Alteryx
•
Excel
•
Google Analytics
•
Power BI
•
Power Query
Programming language:
Other
What types of files can you work with?
I mainly work with Excel and CSV files. If you have another file format, please message me before ordering so I can check whether it can be used for your project.
What types of data can you work with?
I can work with sales, finance, inventory, marketing, purchasing, supplier, logistics, operations, compliance, and other business data. Please contact me if you are unsure whether your project is suitable.
Can you clean and organize messy data?
Yes. I can remove duplicates, check missing or inconsistent values, standardize names and formats, and organize the data into a clearer and more useful structure.
Can you create Excel charts and dashboards?
Yes. Depending on the selected package, I can create formulas, pivot tables, charts, KPI summaries, and an Excel dashboard based on your data and reporting needs.
What does the Premium package include?
The Premium package includes either an Excel dashboard or a basic one-page Power BI report, based on the agreed scope. Both formats are not included together unless agreed through a custom offer.
