Browse categories
English
$
USD
Connect to your AI



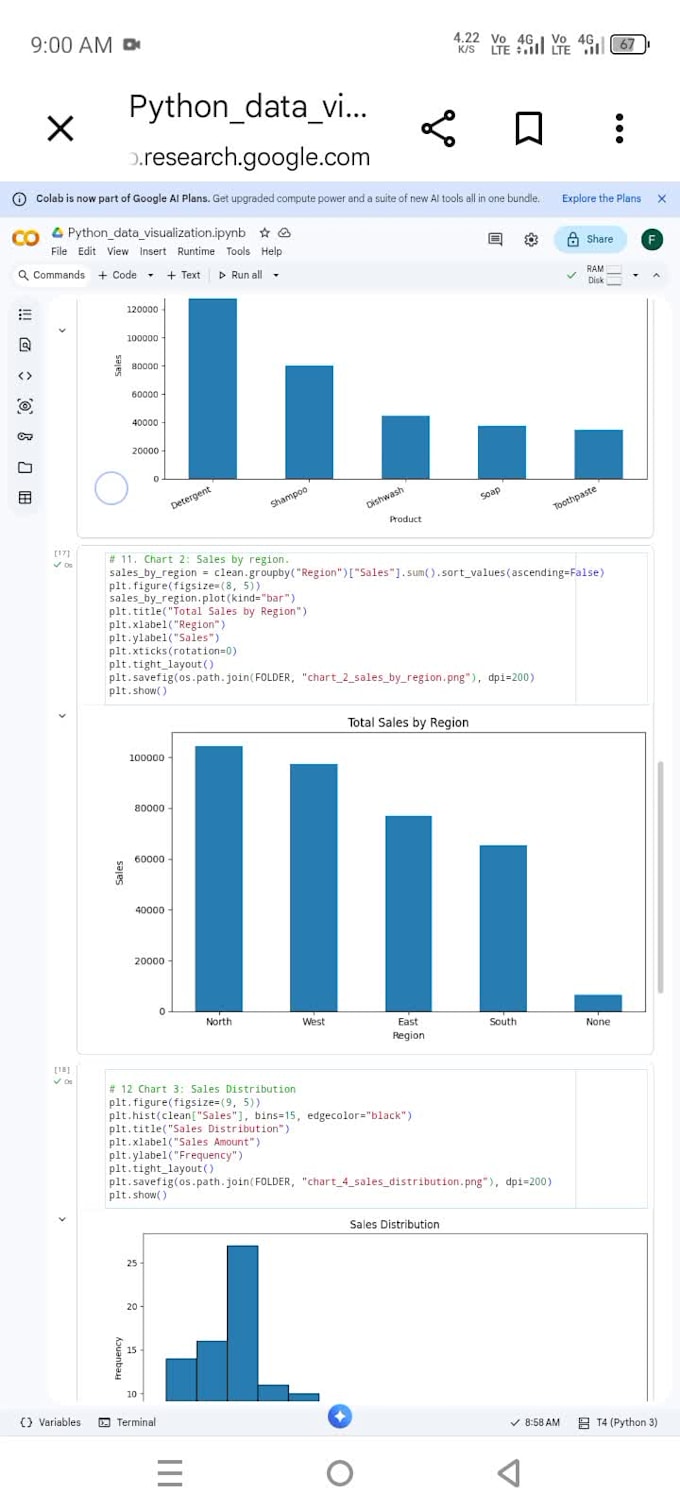
Do you have data but struggle to understand what it tells you?
I will transform your structured data into clear, professional and meaningful visualizations using Python.
I use Python libraries such as Pandas, Matplotlib and Seaborn to create attractive charts that help you understand your data.
My Services Include:
Bar Charts
Line Charts
Pie Charts
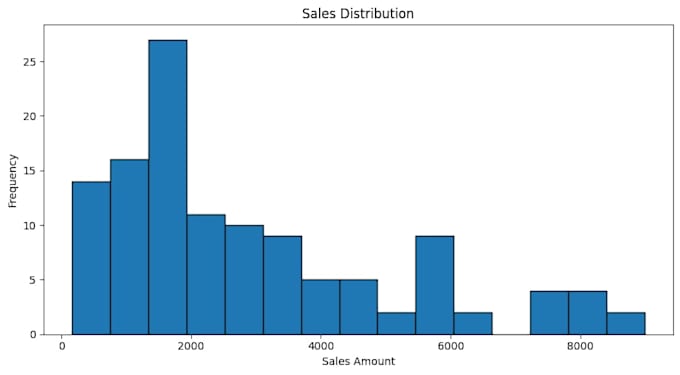
Histograms
Scatter Plots
Distribution Plots
Correlation Heatmaps
Comparative Visualizations
What You Will Receive:
Professionally designed charts.
Clear titles, labels and legends.
High-resolution PNG files.
Basic insights about your visualized data.
Python notebook upon request.
Why Work With Me?
Attention to detail.
Clear communication.
Affordable pricing.
On-time delivery.
Focus on customer satisfaction.
Important: Please contact me before ordering if your dataset requires extensive cleaning, complex analysis or custom visualizations.
Let's turn your data into meaningful visuals!
Buyer Requirements
Upload your CSV dataset.
Explain what you want to visualize.
Mention your preferred chart types, if any.
Share any preferred colors or design requirements.
Data Analyst: Python, Excel and Data Cleaning
Languages
Which file format do you accept?
I primarily accept CSV and Excel files. Please contact me about other formats.
Can you create different types of charts?
Yes. I can create bar charts, line charts, scatter plots, histograms and other standard visualizations.
Will you provide original python code?
Yes, a Python notebook can be included upon request.
Can you clean my dataset?
Data inspection is included.
Can I request a specific chart design.
Yes. You can share a reference image or explain your preferred design.