Browse categories
Explore
Fiverr Pro
English
$
USD
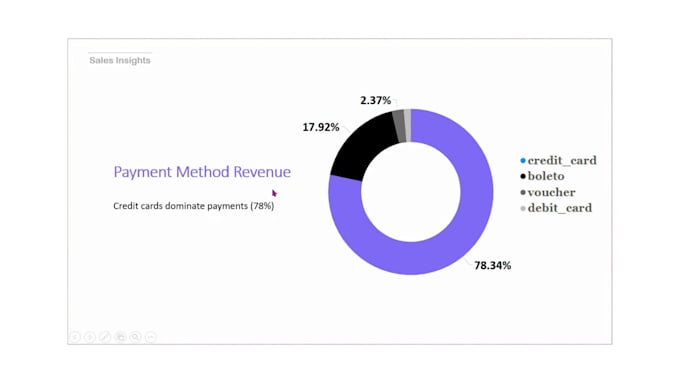
Are you struggling to make sense of your data? Ill help you transform raw numbers into actionable insights using clear, interactive dashboards and compelling storytelling.
With experience analyzing real-world datasets like Global Superstore and Olist, I specialize in uncovering trends, patterns, and business opportunities. Whether its sales performance, customer behavior, or market trends, Ill deliver clean, insightful visuals and concise summaries that support smart decision-making.
Services include:
Problem Definition
️Data Cleaning & Analysis
Dashboard Creation (Power BI / Tableau)
Insight Summary & Recommendations
Executive Presentations
Tools I use: SQL, Excel, Power BI, Tableau, R
Lets turn your data into a powerful business asset. Contact me before placing an order for custom needs!

What do you need from me to get started?
I’ll need your dataset (in Excel, CSV, or database format), a brief explanation of your goals, and any specific KPIs or questions you'd like answered. The clearer your objective, the better the insights.
Which tools do you use for analysis and visualization?
I primarily use Power BI, Tableau, SQL, Excel, Google Sheets, and R to perform in-depth analysis and build interactive dashboards tailored to your business needs. I use PowerPoint for storytelling.
What kind of data can you analyze?
I can work with sales, customer, marketing, product, or operations data—anything structured and ready for analysis. If you're unsure, feel free to message me with a sample.
Can you help me interpret the results?
Absolutely. Every package comes with clear insights and summaries. The Standard and Premium packages include detailed explanations and recommendations for decision-making.
Is my data safe with you?
Yes. I treat all client data as confidential and never share or reuse any data without permission. I’m happy to sign an NDA if needed.