Browse categories
English
$
USD
Connect to your AI
Python and RDKit data analysis for chemistry research
Need your research or laboratory data cleaned, analyzed and converted into clear, professional charts?
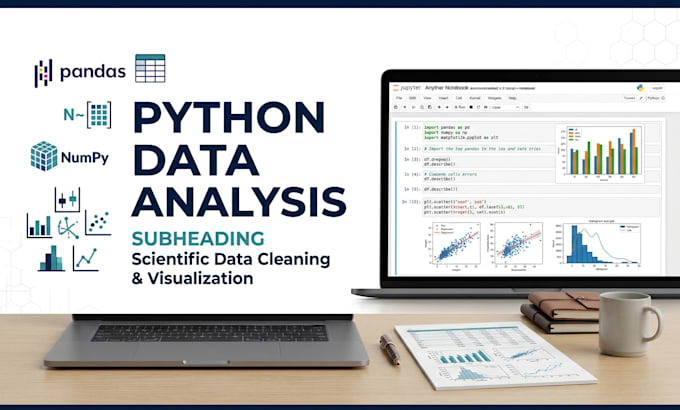
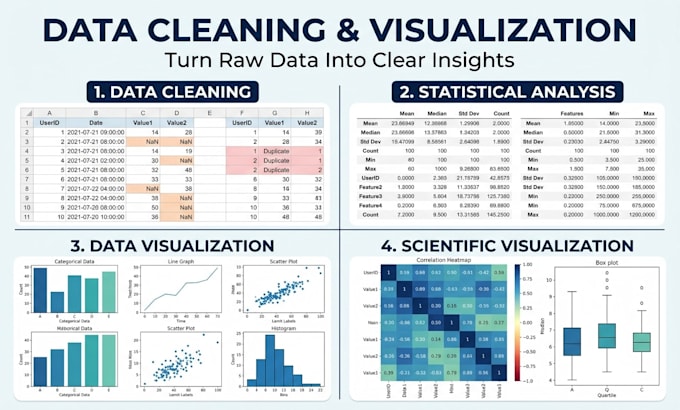
I provide Python-based scientific data analysis using Pandas, NumPy, Matplotlib and Seaborn.
My Services:
What You Will Receive:
Suitable For:
Chemistry students, researchers, laboratory projects and scientific datasets.
My Experience:
Python-based cheminformatics and analysis of approximately 26,600 ChEMBL compounds, with molecular property visualizations.
Please contact me before ordering large datasets or advanced statistical analysis.
What file formats do you accept?
I accept CSV, Excel and TSV datasets.
Which Python libraries do you use?
I primarily use Pandas, NumPy, Matplotlib and Seaborn.
Can you create scientific graphs?
Yes. I can create bar charts, line plots, scatter plots, histograms, box plots and heatmaps.
Do you perform advanced statistical modelling?
I provide basic statistics, exploratory analysis and correlation analysis. Please contact me before ordering advanced statistical modelling.
Will I receive the Python code?
Yes. A documented Jupyter Notebook or Google Colab notebook is included in Standard and Premium packages.
Is my data kept private?
I handle client datasets confidentially and do not share them.
Can you analyze chemistry research data?
Yes. I can work with suitable chemistry, experimental and molecular datasets.