Browse categories
Explore
Fiverr Pro
English
$
USD


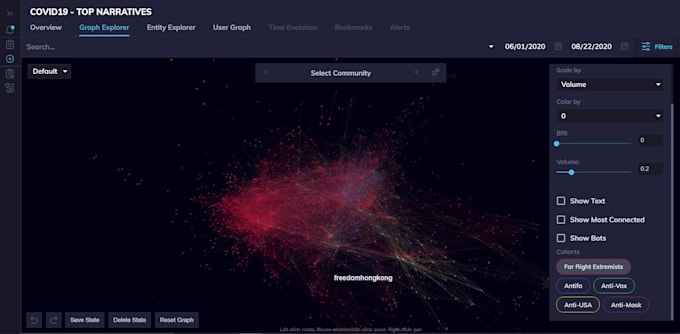
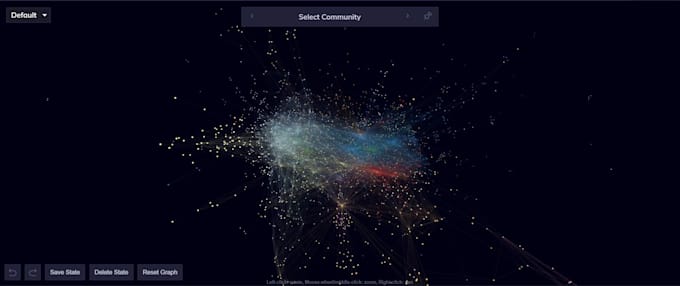
I can create a nice 3 dimensional force graph using webgl, three.js and javascript.
You can show entities and their relationships with this kind of graph.
For example, you can show twitter users and hashtags and observe who tweets what. You can extract narrative from this graph and see the big picture behind the community and its activity.
NOTE! Please do not send an order without discussing it with me first.
Senior Fullstack and data visualization Engineer
Languages
Will I have an interactive demo during the work?
Yes, I will setup a private github repository and create a demo on github pages
Will I need to provide data?
Would be better to provide your data, but I can also create a dummy data as per your requirements.
How easy it is to integrate the map in different environments (React, Angular, Vue)?
It is very straightforward to integrate in any environment, since I write a module in pure JavaScript which is compatible with all JS frameworks.
Will the chart module be re-usable?
Yes, all charts I create is re-usable and configurable as per your needs.
Will it support zoom, pan, and other user interactions?
Yes, it will have all the user interactions.
How quick will I have a working example?
You will have a first draft working example in 1-2 days.
| (1) | ||
| (0) | ||
| (0) | ||
| (0) | ||
| (0) |

drossli

United States
Delivered quickly, on time, and very efficient
| (1) | ||
| (0) | ||
| (0) | ||
| (0) | ||
| (0) |
drossli
United States
Delivered quickly, on time, and very efficient