Browse categories
Explore
Fiverr Pro
English
$
USD
Quality Executive
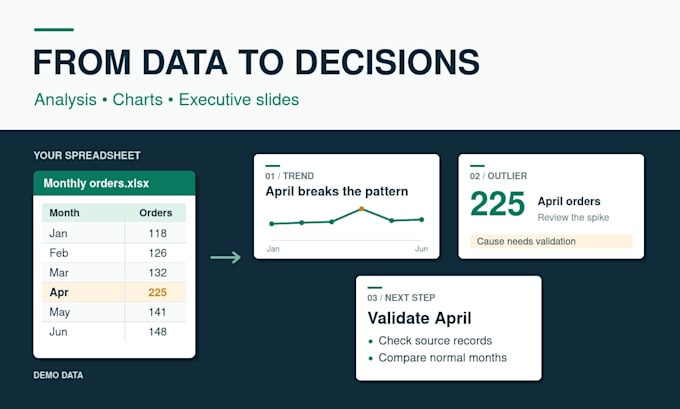
I analyze Excel or CSV data to highlight trends, unusual values and business questions worth investigating. Receive clear findings, charts, assumptions and practical next steps.
BASIC: 1 table, up to 10,000 rows and 25 columns; 1 question, up to 3 charts, Excel analysis and a 1-page summary.
STANDARD: up to 2 related tables, 25,000 rows total and 30 columns per table; up to 3 questions, 5 charts, Excel analysis and a 3-page brief.
PREMIUM: up to 3 related tables, 50,000 rows total and 40 columns per table; up to 4 questions, 6 charts, Excel analysis, an editable PowerPoint of up to 8 slides and matching PDF.
Each package includes data-quality checks, minor preparation and an unusual-values review. You supply business definitions and join keys where needed. Findings depend on the data; unusual values are not automatically errors or proof of a cause.
Message me first for complex joins, major cleanup, forecasting, web extraction or reusable report automation. Packages cover one completed analysis. Revisions cover the agreed data and questions.

Programming language:
Python
Technology:
Excel
Analysis Type:
Descriptive Analysis
Expertise:
Business Insights
•
Anomaly detection
Tools:
Microsoft Excel
What data can I send?
Structured XLSX or CSV sales, inventory or operational data with clear headers. Basic: 1 table, 10,000 rows, 25 columns. Standard: up to 2 tables, 25,000 total rows, 30 columns each. Premium: up to 3 tables, 50,000 total rows, 40 columns each.
What does the unusual-values review include?
Checks for unusual values, missing entries, duplicates and relevant patterns using suitable methods. I explain the checks and flag records. Unusual values may be legitimate, and there may be no material anomalies. Associations do not establish causes.
Can you combine multiple tables?
Standard and Premium include related tables with clear existing join keys. Identify what each row represents and the connecting fields. Ambiguous matches, complex joins or major reconstruction require a separate scope before ordering.
Will my report refresh automatically?
These packages deliver one completed analysis. Premium includes an editable PowerPoint and matching PDF. Reusable generators, scheduled refresh, live connections, deployment and maintenance require a separate scope and feasibility check.
What does a revision include?
Refining the presentation, explanations or agreed analysis using the original data and questions. New data, extra questions or deliverables require a separate scope. Basic and Standard include 1 revision; Premium includes 2.
How should I prepare data and handle AI restrictions?
Share only authorized, anonymized data. Remove passwords, payment details and unnecessary identifiers. AI-assisted tools may support the work; I remain responsible for validation. Discuss confidentiality or non-AI requirements before sharing so we can confirm a suitable workflow.