Browse categories
Explore
Fiverr Pro
English
$
USD
Turn your messy data into clear, interactive dashboards.
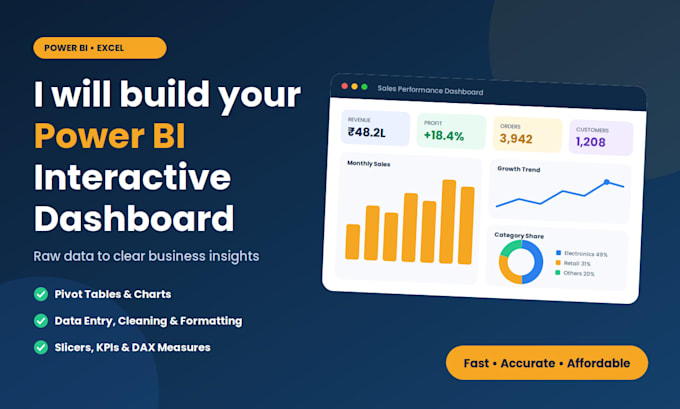
Struggling with scattered Excel sheets, manual reports or messy data? I will convert your raw data into a clean, professional and easy to understand dashboard, so you can take decisions faster.
What I offer:
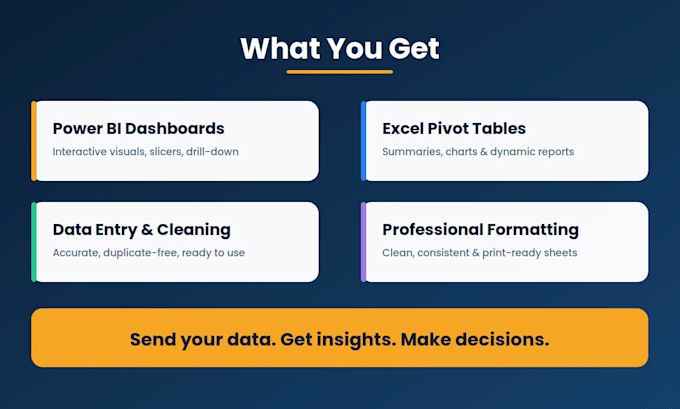
Power BI interactive dashboards (KPIs, charts, slicers, filters, drill-down)
Excel pivot tables and pivot charts
Excel interactive dashboards
Data entry (accurate, with double-checking)
Data cleaning (duplicates, blanks and errors removed
Professional formatting of Excel sheets (print-ready and consistent)
Why choose me?
Background in accounting, finance and compliance, so I understand business numbers, not just charts
Clean, professional and user-friendly design
Accurate work with attention to detail
On-time delivery and clear communication
Revisions until you are satisfied (as per package)
100% confidentiality of your data
How it works:
1️ Share your data (Excel / CSV / Google Sheet)
2️ Tell me what you want to see (sales, finance, inventory, HR, etc.)
3️ I clean, model and build your dashboard
4️ You review, I revise, and you get the final files
Perfect for: small businesses, startups, accountants, sales and others.


Technology:
Excel
•
Google Sheets
•
Power BI
Analysis type:
Statistical analysis
Expertise:
Forecasting
Programming language:
Other
Tools:
Microsoft Excel
•
Other
1. Which tools do you use?
Microsoft Power BI Desktop and Microsoft Excel.
2. What file formats can you work with?
Excel (.xlsx), CSV, Google Sheets, and PDF (for data entry).
3. Will my data be safe?
Yes. Your data is kept strictly confidential and is never shared with anyone.
4. I don’t know what my dashboard should show. Can you help?
Yes! Share your data and goal and I will suggest the right KPIs and charts.
5. Do I get the source file?
Yes, the final .pbix or .xlsx file is delivered with your order (the .pbix is a paid extra in the Basic and Standard packages).