Browse categories
English
$
USD
Connect to your AI

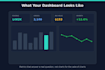
You have data spread across spreadsheets or a database and no clean way to see what's happening. I turn that into a Power BI dashboard your team can actually read and act on.
Over four years of building analytics and reporting for CDC data platforms, plus a portfolio SQL project analyzing 260,920+ data points (IPL cricket, 16 years, window functions, multi-table joins), show the same discipline I bring to a dashboard: the metric on the screen answers a real question, not just fills space.
What you get:
Requirements from buyer: access to the data (file export or read access to the source), and the one or two decisions this dashboard needs to support.
Data Analyst SQL, Python and Power BI
Languages
Do I need a Power BI license?
Power BI Desktop is free; you only need a paid license (Pro/PPU) if you want to publish and share it inside an org workspace, which I can walk you through.
Can you connect to Snowflake / Azure / a live database?
Yes, live connections are included on every tier. Higher tiers add more dashboard pages and a live walkthrough call
What if I don't know what metrics I need yet?
Send me a sample of the raw data and the business question, and I'll propose the metric set before building.