Browse categories
Explore
Fiverr Pro
English
$
USD

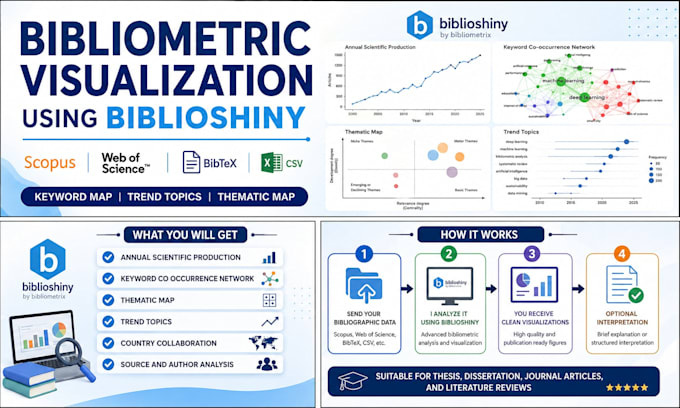
Are you working on a literature review, systematic review, thesis, dissertation, or journal article and need professional bibliometric visualizations?
I will create clear and publication ready bibliometric visualizations using Biblioshiny based on your Scopus, Web of Science, BibTeX, CSV, or compatible bibliographic data.
This Gig can help you generate:
You will receive high quality figures and, depending on your selected package, brief explanations or structured academic interpretation. These outputs are suitable for research articles, thesis, dissertation, and literature review manuscripts.
Please provide your bibliographic data file before placing an order. If you are not sure about the file format, you can message me first and I will guide you.
Languages
