Browse categories
Explore
Fiverr Pro
English
$
USD
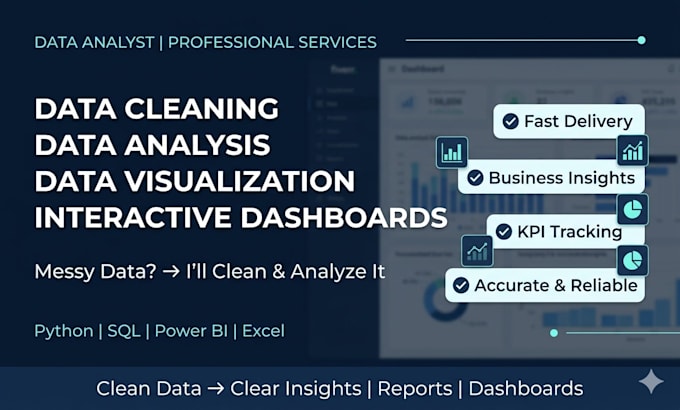
Looking for a complete data analysis solution from raw data to actionable insights?
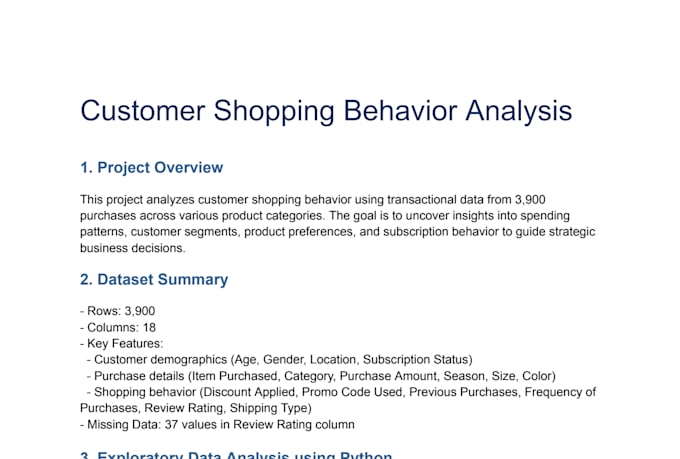
I will analyze your dataset end-to-end using Python, SQL, and Power BI the same workflow I used to analyze a 3,900-row retail customer dataset to uncover revenue trends, customer segments, and subscription behavior.
What I will do for you:
Python (Data Cleaning & EDA)
- Clean your raw data (handle missing values, fix formatting, remove duplicates)
- Perform full Exploratory Data Analysis (EDA)
- Create visualizations (bar charts, heatmaps, distributions)
- Engineer new features if needed
SQL (Business Analysis)
- Load your data into a structured database
- Write queries to answer your business questions
- Customer segmentation, revenue breakdowns, top products, trends
Power BI (Interactive Dashboard)
- Build an interactive dashboard with KPI cards
- Charts filtered by your key dimensions
- Slicers for gender, category, time period, or whatever fits your data
Final Deliverables:
- Cleaned dataset (CSV)
- Python notebook (.ipynb)
- SQL queries file (.sql)
- Power BI dashboard (.pbix)
- PDF report summarizing findings
- PowerPoint presentation (Premium only)