Browse categories
English
$
USD
Connect to your AI
Flow Management and Data Reporting Specialist
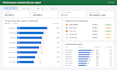
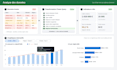
Je créerai un tableau de bord professionnel et interactif Power BI ou Excel à partir de vos données, avec des KPI, des graphiques et des indicateurs de performance clairs. Je peux également nettoyer et transformer vos données pour fournir un rapport clair et exploitable.

What do you need from me to create the dashboard?
I need your Excel or CSV data, your preferred KPIs, and any specific requirements or examples you would like me to follow.
Can you create dashboards in both Excel and Power BI?
Yes. I can create professional dashboards using Microsoft Excel or Power BI, depending on your needs and the type of data you provide.
Can you work with my existing Excel file?
Yes. I can work with your existing Excel file, organize the data, create KPIs and charts, and build a clear and professional dashboard
Can you create interactive dashboards with filters?
Yes. I can add interactive filters, slicers, KPIs, charts and other dashboard elements depending on the selected package.
What is included in the Basic package?
The Basic package includes a simple dashboard with KPIs and charts based on your Excel data. For more advanced dashboards, you can choose the Standard or Premium package.
Can you customize the dashboard to match my business needs?
Yes. I can customize the dashboard layout, KPIs, charts, filters and other elements according to your business requirements and the data provided.
Can I contact you before placing an order?
Yes. If you are unsure which package is right for your project, feel free to contact me before placing an order. I will review your requirements and recommend the most suitable option.
Can you work with large or complex datasets?
Yes, I can work with structured and moderately complex datasets. For very large or complex projects, please contact me first so I can review the requirements and provide the right solution.


