Browse categories
English
$
USD
Connect to your AI
DevOps Engineer AWS Docker Kubernetes Terraform CICD Gitops
Need a clear and reliable way to monitor your server or application?
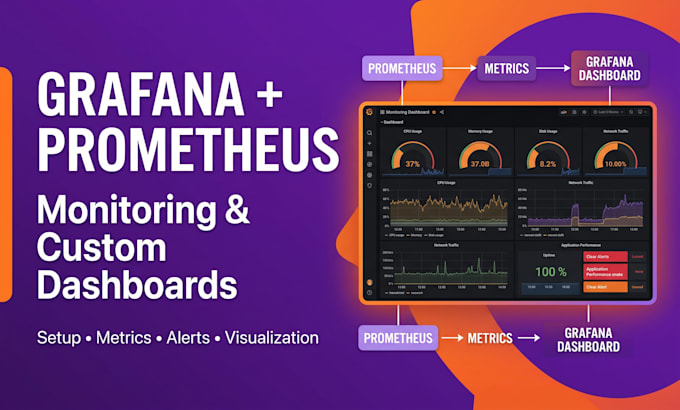
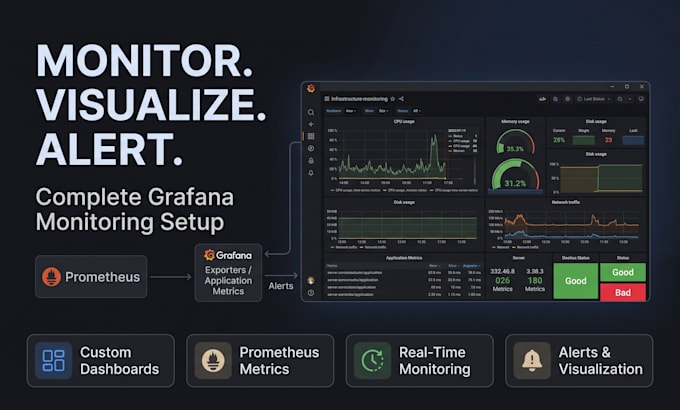
I will set up and configure Grafana and Prometheus to turn your application or infrastructure metrics into useful, easy-to-understand monitoring dashboards.
What I can provide
Supported Monitoring
The setup can be configured for common infrastructure and application metrics, depending on your environment and available exporters or metric sources.
What you will receive
A configured Grafana + Prometheus monitoring setup with dashboards tailored to the agreed requirements.
I will work with your existing environment and avoid unnecessary changes to your application or infrastructure.
For complex Kubernetes, AWS, multi-server, or advanced observability requirements, please contact me before ordering so the scope can be confirmed.


Tools:
Kubernetes
•
Docker
•
Other
Frameworks:
Other
Cloud Provider:
Amazon Web Services
Programming language:
Bash
•
Python
Expertise:
Installation
•
Debugging
•
Configuration
1. Can you set up Grafana and Prometheus on my server?
Yes. I can install, configure, and connect Grafana with Prometheus on your server or existing environment.
2. Can you create a custom Grafana dashboard?
Yes. I can create dashboards with custom panels based on the metrics and monitoring requirements you provide.
3. Do you support Docker-based Grafana and Prometheus setups?
Yes. I can deploy Grafana and Prometheus using Docker and configure the required connectivity and monitoring components.
4. Can you configure monitoring alerts?
Yes. Standard and Premium packages can include alert configuration based on your agreed monitoring requirements.
5. What information do you need before starting?
I need access to the required server or environment, the monitoring requirements, and details about the metrics or application you want to monitor.