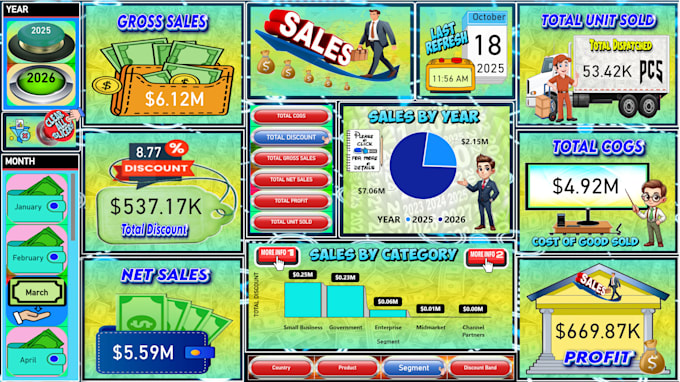
A GRAPHICAL SALES POWER BI DASHBOARD. It shows the total cogs, revenue, profit and etc.
It also shows the country, segment and band discount.
Tool
Power BI
Chart type
Concept
Hierarchy
Location
Overtime
Patterns
Processes
Gantt chart
Get to know Henry Jr
Henry Jr
POWER BI AND EXCEL DASHBOARD EXPERT
FromPhilippines
Member sinceAug 2025
Languages
English
Business Analyst with expertise in SAP data analysis, Power BI, and Excel visualization. Skilled in data-driven decision-making and experienced in transforming complex datasets into actionable insights to drive strategic business improvements.