Browse categories
Explore
Fiverr Pro
English
$
USD

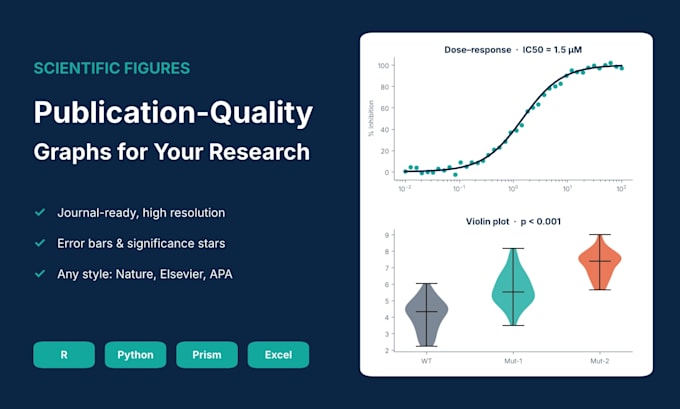
Need clear, professional figures for your thesis, paper or presentation? I'm Hidayat, a molecular biologist (MS Molecular Biology) and data analyst. I turn your research data into publication-quality scientific graphs that meet journal standards.
Graphs I create:
Bar charts with error bars and significance stars
Box, violin and scatter plots
Line and time-course graphs
Dose-response curves and IC50
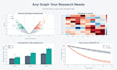
Heatmaps, volcano plots and PCA plots
Kaplan-Meier survival curves
Multi-panel figures (A, B, C...)
Tools: R (ggplot2), Python, GraphPad Prism and Excel
You get:
High-resolution files (PNG, TIFF, PDF, 300+ DPI)
Formatting for your target journal
Clean labels, colors and consistent style
Editable source file on request
Please message me before ordering with your data and the graphs you need.
Research Data Analyst for Life Sciences R and SPSS
Languages
What do you need from me?
Your data (Excel, CSV or Prism file), the type of graph you want, and your journal’s figure guidelines if you have them.
Can you match a specific journal’s style?
Yes. Send me the journal name or its author guidelines and I’ll follow its size, font and resolution requirements.
Can you improve graphs I already made?
Yes. Send your current figure and data, and I’ll redesign it to look professional.
Do you run statistical tests for the graphs?
I can add significance marks from results you provide. For full statistical analysis, see my biostatistics gig.
Which file formats will I receive?
PNG and PDF by default, and TIFF or SVG on request.