Browse categories
Explore
Fiverr Pro
English
$
USD

Bring your data to life with stunning visualizations! Using the powerful D3.js library and React 3D Graph, I will create interactive, dynamic, and visually appealing charts and graphs tailored to your specific needs.
Line Charts: Display data trends over time with sleek, informative line charts.
Bar Charts: Compare categories and visualize data distribution with vibrant bar charts.
Pie Charts: Showcase proportions and part-to-whole relationships with engaging pie charts.
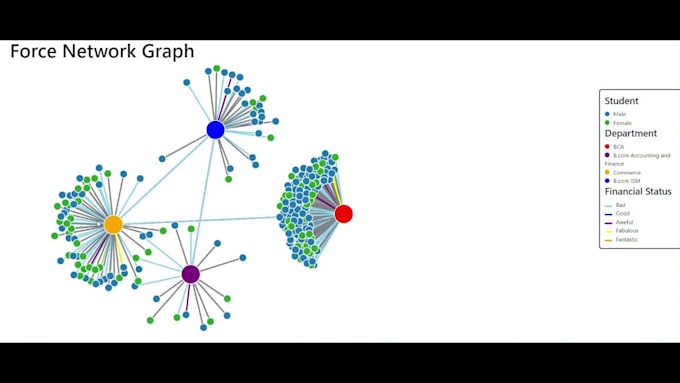
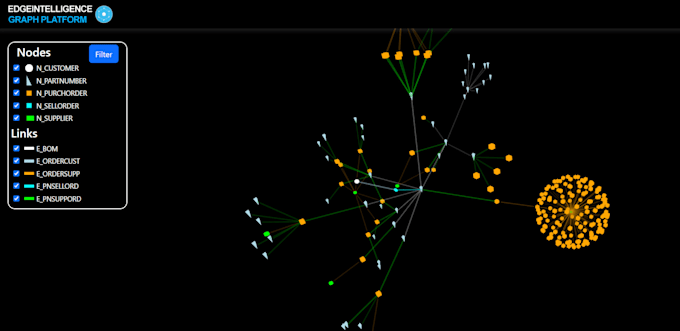
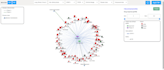
Force Network Graphs: Reveal complex relationships and connections within your data.
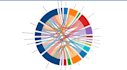
Chord Diagrams: Illustrate inter-relationships between data points with elegance.
Custom Visualizations: Need something unique? I can craft bespoke visualizations to meet your specific requirements.
Let's transform your data into clear, engaging, and insightful visual stories that will captivate your audience. With a keen eye for detail and a commitment to excellence, I ensure each project is crafted to perfection. Get in touch today to start bringing your data to life!
Languages