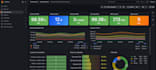
I will set up grafana monitoring and observability stack

Vietnam

I speak English, Vietnamese

Security and DevOps Engineer

Security Operations & Observability Engineer with hands-on experience running production log management, SIEM, and monitoring infrastructure. I specialize in the Elastic Stack (Elasticsearch, Logstash...
About this Gig

I build production-style observability stacks using Grafana, Loki (logs), Prometheus and Mimir (long-term metrics storage) a modern alternative to running separate log and metrics systems. Ideal if you're scalingpast a basic Prometheus+Grafana setup.


What you get:

  • Prometheus configured with the right exporters for your stack
  • Loki configured for log ingestion at your scale
  • Mimir set up for long-term metrics retention
  • Grafana dashboards unifying logs and metrics in one place
  • Customized alert rule, alert template.


Let me know what you want monitored (servers, app metrics, etc.) and I'll take it from there.