Looks Like This Service Is On Hold

I will create professional data visualization, graphs and charts in excel

H
horizone_9797
H
horizone_9797
Sanjay

About this gig

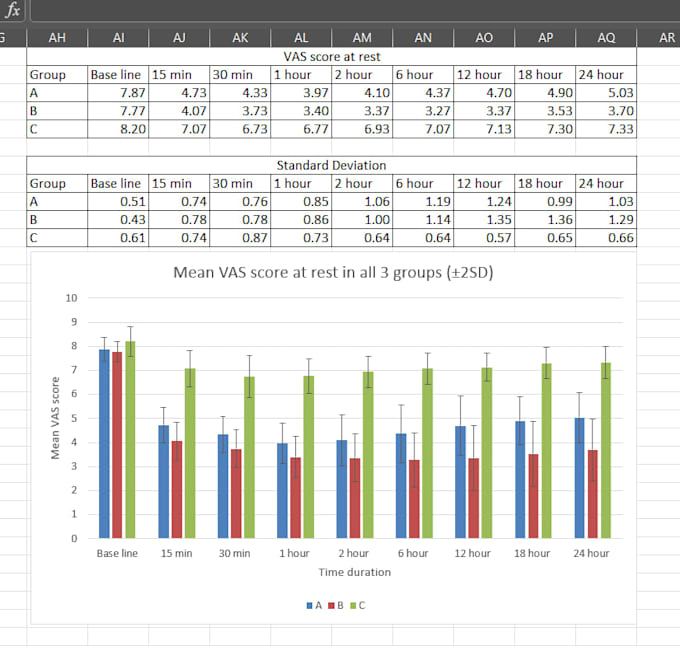
Do you have raw data but struggle to make it easy to understand?

I will transform your data into clear, professional, and visually appealing graphs, charts, and dashboards in Excel.


Clean and organize your data

Create customized charts & graphs

Design interactive dashboards (Premium)

Deliver insights in a professional format


Whether its for business reports, presentations, academic projects, or decision-making, Ill make your data speak visually and effectively.

Get to know Sanjay

Sanjay

Biostatistics and Research Data Analyst, Accurate and clear

5.0(1)
  • FromIndia
  • Member sinceJul 2023
  • Last delivery7 months
  • Languages

    Hindi, Gujarati, English
I am a postgraduate in Community Medicine, skilled in biostatistics & data analysis 📊. I use Jamovi & Excel to make research data simple and publication-ready. ✅ Descriptive statistics & tables ✅ Chi-square, t-test, ANOVA ✅ Regression (linear, logistic, survival) ✅ Thesis & dissertation analysis ✅ Publication-ready graphs & APA formatting 🎯 I provide clear, easy-to-understand explanations + professional outputs for medical & public health research.