Browse categories
Explore
Fiverr Pro
English
$
USD
Statistician, Data Analytics, Tutor, R Studio, SPSS Expert
I'm working as an Assistant Prof. of Statistics in Higher Education Department, Pakistan, with a 12 year of teaching experience. As a PhD scholar in applied statistics, I'm here to help you to taught the statistical software like SPSS, R Studio and subject of Statistics in following related fields.
· Introduction to Statistics
· Presentation of data (Bar chart, Pie- chart, Histogram e.t.c)
· Descriptive Statistics (Measure of Central Tendency and Dispersion)
· Index Number
· Probability
· Random Variable
· Discrete Probability Distributions
· Continuous Probability Distributions
· Sampling Techniques and Sampling Distributions
· Statistical Inference
· Hypothesis testing
· Regression and Correlation
· Research Methodology
· Experimental Design
· Parametric and Non-Parametric Test
· Vital Statistics
· SPSS
· R Studio
· Survival Analysis
With my expertise, you will feel a significant increase in your knowledge and interest in the subject of Statistics as well as in grades.
Feel free to contact before placing order.

Subject:
Intermediate statistics
•
Statistics
•
Probability
Grade level:
College
Asking sellers to prepare homework/academic works on your behalf is against Fiverr’s Community Standard and may lead to your account being disabled.
Question: What is the purpose of descriptive statistics?
Answer: Descriptive statistics is used to summarize and describe the main features of data, such as measures of central tendency (mean, median, mode) and dispersion (variance, standard deviation).
Question: What is the difference between a bar chart and a pie chart?
Answer: A bar chart represents data using rectangular bars of different heights, while a pie chart represents data as a circle divided into sectors, with each sector representing a different category or proportion.
Question: What are the steps involved in hypothesis testing?
Answer: The steps in hypothesis testing include stating the null and alternative hypotheses, selecting a significance level, collecting data, calculating a test statistic, determining the p-value, and making a conclusion based on the results.
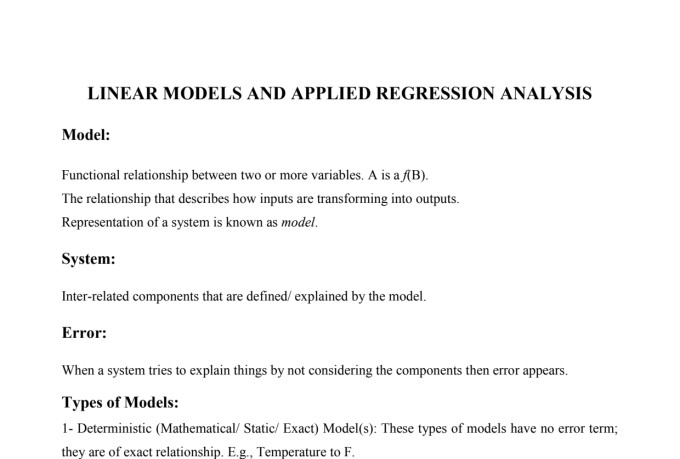
Question: What is the concept of regression in statistics?
Answer: Regression is a statistical technique used to model the relationship between a dependent variable and one or more independent variables. It helps in predicting and understanding the relationship between variables.
Question: How does SPSS software assist in statistical analysis?
Answer: SPSS (Statistical Package for the Social Sciences) is a software package used for statistical analysis. It provides a user-friendly interface and a wide range of statistical procedures and data manipulation tools, making it useful for tasks such as data cleaning, exploration e.t.c.
Question: What is the importance of sampling techniques in statistics?
Answer: Sampling techniques are essential in statistics as they allow researchers to gather data from a subset of a larger population. By using appropriate sampling methods, researchers can make inferences and draw conclusions about the entire population based on the collected sample.
Question: What are parametric and non-parametric tests in statistics?
Answer: Parametric tests assume specific characteristics about the data distribution, such as normality and homogeneity of variance, and are used when these assumptions are met. Non-parametric tests, on the other hand, do not rely on such parametric assumptions used for data.
Question: How does survival analysis contribute to statistical research?
Answer: Survival analysis is a statistical method used to analyze time-to-event data, such as time to death or time to failure. It helps researchers understand the factors influencing the probability of an event occurring and estimate survival probabilities over time.
Question: What is the role of index numbers in statistical analysis?
Answer: Index numbers are used to measure changes in a variable or a group of variables over time. They provide a way to compare values relative to a base period, making it easier to track changes in variables such as prices, production levels, or economic indicators.
Question: How does correlation measure the relationship between variables?
Answer: Correlation measures the strength and direction of the linear relationship between two variables. It ranges from -1 to +1, where -1 indicates a perfect negative relationship, +1 indicates a perfect positive relationship, and 0 indicates no relationship between the variables.
| (1) | ||
| (0) | ||
| (0) | ||
| (0) | ||
| (0) |

illicitedd

United States
Mr. Hussnain is an amazing teacher. I came in with zero knowledge of R programming, and he made everything so easy to grasp. He patiently went over the basics, explaining each part in a way that really clicked for me. He made learning both enjoyable and accessible. He even tailored the course to fit my needs. I highly recommend him as a tutor.
Up to $50
Price
1 day
Duration
| (1) | ||
| (0) | ||
| (0) | ||
| (0) | ||
| (0) |
illicitedd
United States
Mr. Hussnain is an amazing teacher. I came in with zero knowledge of R programming, and he made everything so easy to grasp. He patiently went over the basics, explaining each part in a way that really clicked for me. He made learning both enjoyable and accessible. He even tailored the course to fit my needs. I highly recommend him as a tutor.
Up to $50
Price
1 day
Duration