Browse categories
Explore
Fiverr Pro
English
$
USD

_ym07ja.jpg)
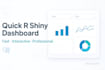
Need a custom R Shiny dashboard or interactive data visualization for your project?
I specialize in R Shiny dashboard development that transforms your data into powerful, real-time analytics. Perfect for prototype analytics, data apps, and interactive visualization tools.
What you get:
Perfect for:
Why choose my R Shiny service?
Every interactive dashboard is lightweight, scalable, and built with best practices. Your custom dashboard will be production-ready and easy to extend.
Transform your data into insights!
Send your dataset and requirements I'll deliver a working R Shiny dashboard fast. Let's build your interactive data visualization solution!
Data Engineering, R Shiny, Data Pipelines, DBt, Databricks, Snowflake
Languages
Will I get the R code?
Yes, full commented code is included in every package.
Can you connect to databases or APIs?
Yes, available in the Premium package or as an add-on.
Can you deliver in 24 hours?
Yes — choose the “Extra Fast Delivery” option at checkout.
Can I upgrade this project later?
Absolutely — this gig can be expanded into a full enterprise dashboard (see my main gig).
Will I get the complete R Shiny code?
Yes! You'll receive all R code for your interactive dashboard, fully documented and ready to customize. The R Shiny application includes setup instructions for easy deployment.
Can you connect the R Shiny dashboard to databases or APIs?
Yes! I can integrate your interactive dashboard with databases (MySQL, PostgreSQL) or APIs to create dynamic, real-time data visualization. Contact me to discuss your data connection needs.
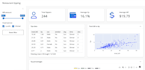
What types of data visualization can you create in R Shiny?
I can build interactive charts including bar plots, line graphs, scatter plots, heatmaps, and maps using ggplot2 and Plotly for professional data visualization in your R dashboard.


