Browse categories
Explore
Fiverr Pro
English
$
USD


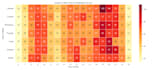
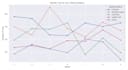
Turn messy data into clean, useful insights!
BASIC DATA CLEANING
Clean and organize one dataset up to 10,000 rows. Includes duplicate and missing-value checks, data formatting, basic corrections, and a clean output file. No charts or business analysis included.
STANDARD DATA ANALYSIS
Everything in Basic, for datasets up to 100,000 rows, plus key metric calculations, trend analysis, up to 3 charts, and a summary of the main findings.
PREMIUM BUSINESS INSIGHTS
Everything in Standard, for datasets up to 1,000,000 rows, plus advanced analysis, up to 10 relevant charts, a summary report, and actionable business recommendations.
FORMATS
CSV, Excel, and JSON. SQL data can be supported when provided as an export or accessible dataset.
TOOLS
Python, Pandas, NumPy, SQL, Excel, Matplotlib, and Seaborn.
DELIVERABLES
Cleaned files, charts, analysis results, and reports according to your selected package.
Please upload your dataset and describe your goal. Complex data issues may require additional work. Let's make your data work for you!
Data and Operations Specialist, SAP, Excel and Python Automation
Languages
What Python libraries do you use for data visualization?
I mainly use Seaborn and Matplotlib for clean, publication-quality static charts
Can you match my company's brand colors and visual style?
Yes! Just share your brand color palette (HEX codes) or design guidelines, and I will customize all charts and reports to match your style.
What format will I receive the final visualizations in?
You will receive high-resolution image files (PNG, JPEG, or PDF). If requested in the Premium package, I can also deliver charts and the complete Jupyter Notebook code.
What do I need to provide to get started?
Please upload your dataset (CSV or Excel) and share any specific questions, KPIs, or goals you want to uncover from your data.


