Browse categories
Explore
Fiverr Pro
English
$
USD

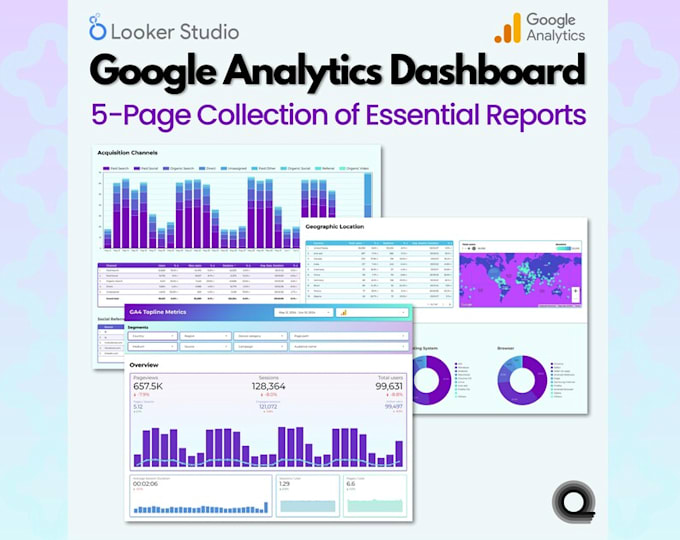

A Looker Studio dashboard is only as reliable as the Google Sheets data behind it. If the source is poorly structured, manually updated or inconsistent, even a beautiful dashboard can produce confusing reports.
I build Looker Studio dashboards powered by Google Sheets with the data structure, calculations, reporting logic and automation considered together. The goal is to turn your raw spreadsheet data into a reporting system that updates with less manual work and gives you useful information at a glance.
What your dashboard can include:
I can create a Looker Studio dashboard, connect it to Google Sheets, automate the reporting workflow and structure the system around the way you actually use your data.
Already have a Google Sheet that you need turned into an automated dashboard? Send me the sheet and tell me what you need to monitorIll help turn the data into a reporting system you can actually use.
ALERT!!!
Languages
Can you create a Looker Studio dashboard using Google Sheets?
Yes. I can connect your Google Sheets data to Looker Studio and build an interactive dashboard around the KPIs, metrics and reports you need to monitor.
Can you automate my Looker Studio dashboard?
Yes. I can structure the Google Sheets data and reporting workflow so your Looker Studio dashboard updates when the underlying data changes, reducing repetitive manual reporting.
Can you work with my existing Google Sheets file?
Yes. If your existing sheet contains the data you need, I can review its structure, organise the data where necessary and connect it to Looker Studio for reporting.
What can a Looker Studio dashboard show?
It can display KPIs, totals, trends, comparisons, tables, charts, performance metrics and other calculated insights. The dashboard is built around the information you actually need to monitor.
Can you create filters and interactive controls?
Yes. I can add date ranges, dropdown filters and other controls that allow you to explore specific periods, categories, products, teams or other dimensions in your data.
Can you create calculated fields in Looker Studio?
Yes. I can create calculated metrics and fields where your reporting requires additional calculations beyond the raw Google Sheets data.
Can you clean or structure my Google Sheets data before connecting it?
Yes. Proper data structure is important for reliable Looker Studio reporting, so I can organise columns, headers, data types and supporting calculations where required.
Will my Google Sheets dashboard update automatically?
If the Google Sheets source is updated correctly, Looker Studio can refresh the connected reporting data. For more advanced automation, I can also help improve the underlying Google Sheets workflow.
Can you redesign an existing Looker Studio dashboard?
Yes. I can improve an existing dashboard's layout, visual hierarchy, charts, filters and reporting structure to make the information easier to understand and use.
