Browse categories
English
$
USD
Connect to your AI
Back Office Operational
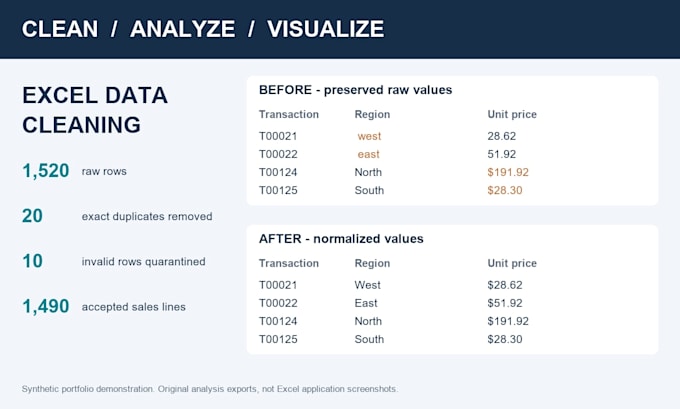
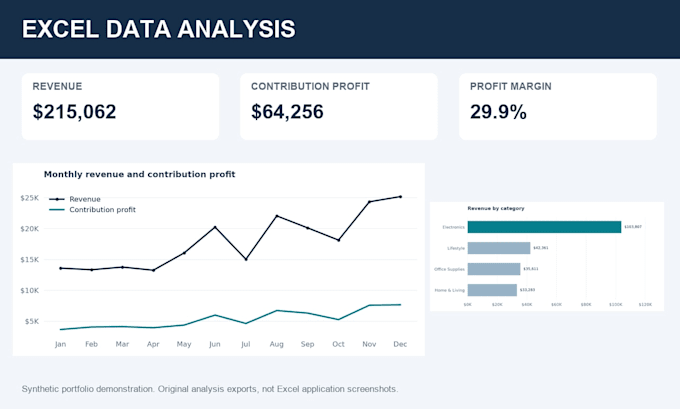
Do you have raw or messy data and need help turning it into useful insights?
I can help you clean, analyze, and visualize your data using Microsoft Excel and Python.
What I can do for you:
Why work with me?
I have an academic background in Business Statistics from Institut Teknologi Sepuluh Nopember (ITS), Indonesia. I approach data tasks with analytical thinking, attention to detail, and a focus on presenting results clearly.
What you will receive:
Please contact me before placing an order if your project involves a large dataset, complex statistical methods, or specific requirements.
Let's turn your data into meaningful insights!

What types of data can you work with?
I can work with structured datasets in Excel and CSV formats. Please contact me first if your data is in another format or requires special processing.
What do you need to get started?
Please provide your dataset, explain your project goals, and share any specific questions or desired outputs. If possible, include a sample of the expected result.
Can you create charts and visualizations?
Yes. I can create charts and visualizations based on your data and selected package. Please let me know which metrics or trends you want to understand.
Can you handle large or complex datasets?
Please contact me before ordering so I can review your dataset, understand the requirements, and confirm whether the project fits my services and delivery time.