Browse categories
English
$
USD
Connect to your AI

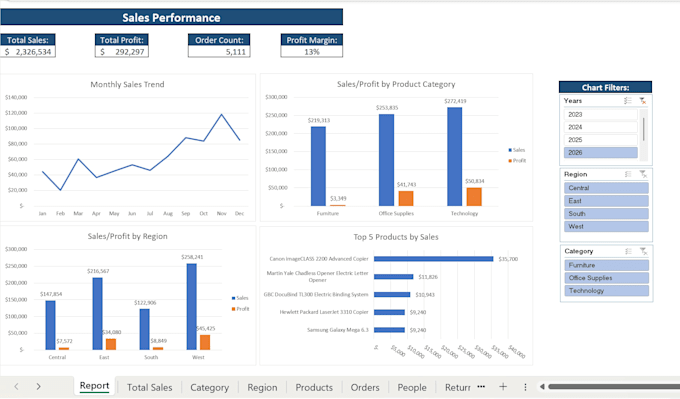
Want to understand your business data without digging through endless rows and spreadsheets?
I'll turn your Excel data into a clear, useful dashboard that highlights key performance indicators, trends, and business performance.
Depending on your package, your dashboard may include:
I focus on creating dashboards that are not only visually clear but also practical to use.
Please provide your data, the metrics you want to track, and the questions you want the dashboard to answer. If you are unsure which metrics to use, I can help define a reasonable set based on your business objective.
The package covers one dashboard page. Recurring multi-file automation and substantially more complex data preparation are quoted separately.
You'll receive an Excel workbook with the agreed dashboard and any included supporting calculations.
Let's turn your data into something useful!
Business Data Analyst, Excel, Power BI, SQL, Python
Languages
Can I update the data later?
Yes! You'll receive an editable Excel workbook. You can add or replace data in the agreed source table and refresh the dashboard to reflect the updates. If you need a repeatable workflow that imports new monthly files, please choose my Automated Excel Reporting gig.
Can you work with multiple data sources?
Potentially, depending on their structure and the selected scope. Please share the files before ordering so I can confirm feasibility.
Will the dashboard be interactive?
Interactive features such as PivotTable filters and slicers can be included when appropriate to the selected package.
