Browse categories
English
$
USD
Connect to your AI




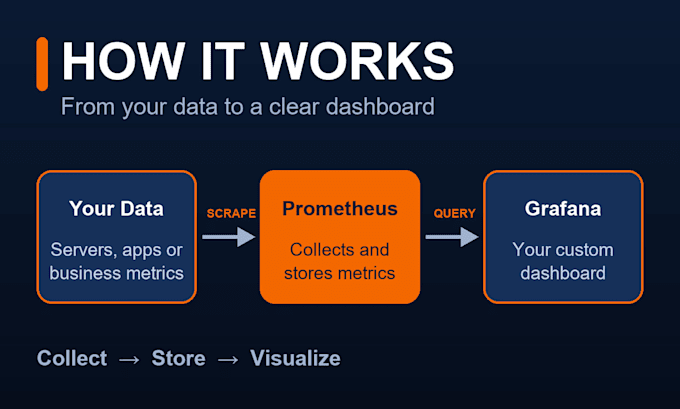
Need a clear, live view of your servers, apps or business metrics? I will set up Grafana and Prometheus for you and build a custom dashboard that shows exactly what matters, so you can spot problems early and make better decisions.
WHAT YOU GET:
HOW IT WORKS:
Pick the package that matches the number of data sources you need, or message me before ordering and I will send a free plan and quote.
Languages
Which data sources can you connect?
Prometheus is the core. I can also connect common sources such as MySQL, PostgreSQL or InfluxDB. Basic connects 1 data source, Standard 3 and Premium 5. Tell me your sources and I will confirm they fit before you order.
Can you work with a Grafana or Prometheus I already run?
Yes. I can add data sources and build a dashboard on an existing Grafana or Prometheus. Tell me the versions and what you want to see, and I will confirm the scope and package before you order.
Where do you install Grafana and Prometheus?
On your own server or virtual machine. I install and configure both tools there so you can use them right away. Tell me your operating system before ordering and I will confirm it fits.
Will I get documentation and support?
Yes. You get documentation that explains the setup and your dashboard, plus support after delivery if you get stuck, so your team can keep using and extending it.
How long does it take?
Delivery is 4 days for Grafana Setup (1 data source), 6 days for Custom Dashboard (3 sources) and 10 days for Full Monitoring (5 sources). Need it faster? Message me and I will tell you what is possible.
| (3) | ||
| (0) | ||
| (0) | ||
| (0) | ||
| (0) |

alex_mcooper

United States
Excellent work and very professional communication. The Grafana dashboard meets our needs perfectly and makes monitoring CPU, memory, requests, and errors much easier.
$50
Price
3 days
Duration

ketts_clark
United States
Great work by Janindu! He created a professional website that matched my expectations perfectly. Very responsive, skilled, and easy to work with. I’m very satisfied with the final result!
$50
Price
3 days
Duration

tharinduprabash

Sri Lanka
wonderful experience with this guy. great job. thanks again.
$50
Price
| (3) | ||
| (0) | ||
| (0) | ||
| (0) | ||
| (0) |
alex_mcooper
United States
Excellent work and very professional communication. The Grafana dashboard meets our needs perfectly and makes monitoring CPU, memory, requests, and errors much easier.
$50
Price
3 days
Duration
ketts_clark
United States
Great work by Janindu! He created a professional website that matched my expectations perfectly. Very responsive, skilled, and easy to work with. I’m very satisfied with the final result!
$50
Price
3 days
Duration
tharinduprabash
Sri Lanka
wonderful experience with this guy. great job. thanks again.
$50
Price