Browse categories
Explore
Fiverr Pro
English
$
USD

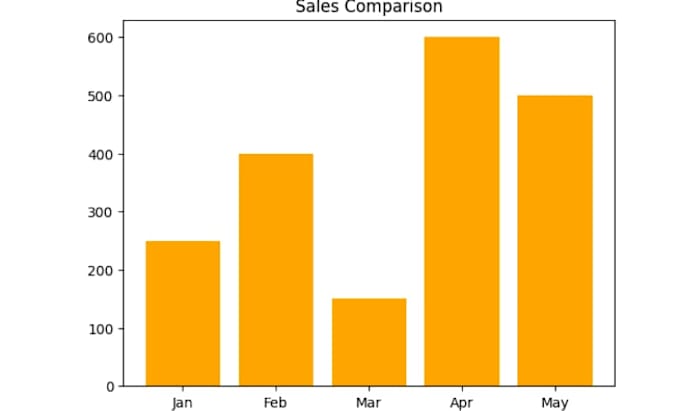
I am a professional Graphic Designer and Python Expert specialized in Data Visualization. I help businesses turn boring Excel/CSV files into accurate, high-quality, and eye-catching charts and infographics.
Unlike others, I use Python (Matplotlib/Plotly) to ensure your charts are 100% mathematically accurate, combined with Adobe Illustrator for a premium, branded look.
What I offer:
I will create professional data visualizations, charts, and infographics using Python.
I specialize in Data Visualization using Python. I don't just create pretty pictures; I transform complex data into clear, impactful, and visually stunning stories that help your business grow.
With a deep command over the Adobe Creative Suite (Photoshop, Illustrator, InDesign) and programming libraries like Matplotlib and Plotly, I offer a hybrid service that
Graphic designing
Languages
What data format do you accept?
I accept data in Excel (.xlsx), CSV, Google Sheets, or even raw text files. Please ensure your data is organized so I can provide the most accurate visualization.
Can you match the charts to my brand colors?
Yes, absolutely! Just provide me with your brand's color codes (HEX or RGB) and your logo, and I will customize the charts to match your brand identity perfectly.