Browse categories
Explore
Fiverr Pro
English
$
USD
Full Stack Developer and Data Solutions Expert
Struggling with messy data? Let me transform it into actionable insights!
I specialize in data cleaning, data preprocessing, data analysis, and data visualization to extract meaningful insights. With expertise in Python, Numpy, Pandas, Matplotlib, Seaborn, I will clean, analyze and visualize your data to make it insightful.
What I Offer:
I provide professional data cleaning, preprocessing, and visualization services to ensure your data is structured, accurate and ready for analysis. Whether you have raw datasets or unstructured data, I will help you get valuable insights through Exploratory Data Analysis (EDA) and interactive visualizations.
What You Will Get:
Note : Before placing an order, please contact me to discuss your project requirements.

What file formats do you accept for data cleaning and analysis?
I work with CSV, JSON, Excel, Google Sheets, and SQL databases. If your data is in another format, feel free to ask, and I will let you know if I can process it.
What kind of data cleaning do you provide?
I offer data cleaning and preprocessing, which includes handling missing values, duplicate removals, formatting corrections, outlier detection and standardization to make your dataset ready for data analysis and visualization.
Can you peform Exploratory Data Analysis (EDA) on my dataset?
Yes, I specilaize in EDA (Exploratory Data Analysis) to uncover patterns, trends, and correlations in your data. I will provide statistical summaries, visual insights, and reports to help you understand your data better.
What type of data visualization can you create?
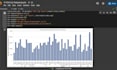
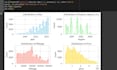
I create bar charts, scatter plots, pie charts, heatmaps, and histograms using tools like Matplolib, Seaborn, and Plotly. Let me know your preferences, and I will tailor the visualization to your needs.
Do you provide Python scripts for the data analysis and visualization?
I will provide well-documented Python scripts with clear explanations so you can easily understand and reuse them for future data processing. data cleaning and visualization tasks.
Do you handle large or complex datasets?
Yes, I efficiently process large datasets (100k+ rows) using Python and Pandas. Whether it's fixing missing values, duplicates, or merging tables, I have got you covered.
What if I need changes after receiving the final deliverable?
I offer free revisions based on your package. Just provide feedback, and I will refine the analysis, visualization, or reports until you are satisfied.