Browse categories
Explore
Fiverr Pro
English
$
USD
Financial Analyst Python and Power BI Ratio Analysis and Excel Macros
Are you looking for an accurate, investor-ready breakdown of your company financial health?
Whether you are a business owner, startup founder, or investor, raw numbers on a Balance Sheet or Income Statement only tell half the story. I will transform your financial data into clear, actionable insights using structured accounting principles, comprehensive ratio analysis, and clean Excel models.
WHAT I WILL DELIVER:
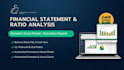
* Complete Financial Statement Analysis: In-depth evaluation of your Balance Sheet, Profit & Loss (Income Statement), and Cash Flow Statement.
* Comprehensive Ratio Analysis:
- Liquidity Ratios (Current, Quick, Cash Ratio)
- Profitability Ratios (Gross Margin, Net Profit Margin, ROE, ROA, ROCE)
- Solvency & Leverage Ratios (Debt-to-Equity, Interest Coverage)
- Efficiency / Turnover Ratios (Inventory, Receivables, Asset Turnover)
* Horizontal & Vertical Analysis: Year-over-year trend evaluation and common-size statement breakdowns.
* Dynamic Excel Templates & Visuals: Automated formulas, clean formatting, and easy-to-read performance charts.
* Executive Written Report: Clear interpretation of what the numbers actually mean, highlighting strengths,risks and cost optimis




Technology:
Excel
•
Google Analytics
•
Google Sheets
•
Power BI
•
NumPy
Analysis type:
Quantitative analysis
Expertise:
Financial ratios
Programming language:
Python
Tools:
Microsoft Excel
What files do you need from me to get started?
Please share your financial statements (Balance Sheet, Income Statement, or Trial Balance) in Excel, CSV, PDF, or clear image format, along with any specific guidelines or time periods you want analyzed.
Will you include formulas in the Excel file or just static numbers?
: All Excel deliverables include clean, dynamic formulas so you can see exactly how every ratio and metric was calculated and update figures in the future.
Can you also visualize the financial data with charts and graphs?
: Yes! My Premium package includes visual charts and dashboard summaries (and I can also generate advanced statistical visualizations using Python/Seaborn if required).


