Browse categories
Explore
Fiverr Pro
English
$
USD

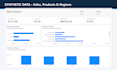
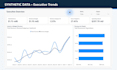
Make better use of your business data with a clear, interactive Power BI dashboard.
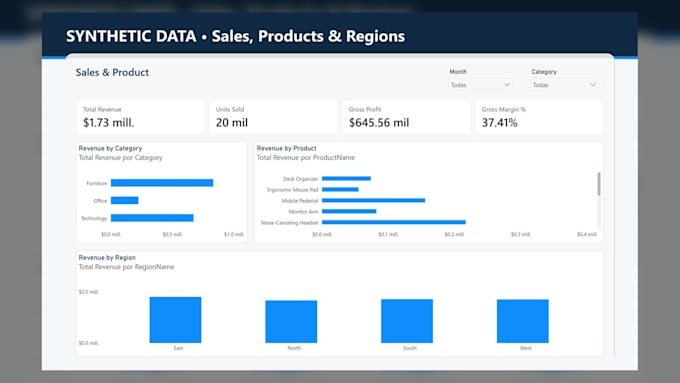
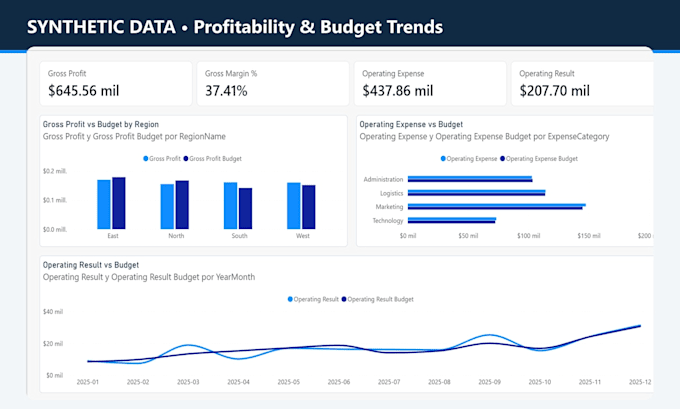
I build reports that turn structured Excel and CSV files into defined KPIs, useful visuals, and practical business views. Depending on your package, I can prepare data with Power Query, create a clean model, write DAX measures, and add filters for agreed dimensions.
Typical use cases include sales, expenses, budgets, financial summaries, and operational reporting. You will receive an editable Power BI Desktop file and the additional deliverables listed in your package.
Each project starts with your business questions, KPI definitions, source files, and expected refresh process. I check calculations and layout consistency before delivery.
Please contact me before ordering if you need databases, APIs, Power BI Service setup, scheduled refresh, gateways, complex RLS, or enterprise modeling.
Economics Student and Preprofessional Planning and Budget Intern
Languages
What files do you need to get started?
Please send the Excel or CSV files included in your package, KPI definitions, business questions, preferred currency, language, and reporting period.
What exactly is included in my package?
Each package has a fixed number of sources, dashboards, KPIs, and visuals. Contact me before ordering if you are unsure which package fits your data.
Can you work with messy or incomplete data?
Simple transformations may be included. Extensive cleaning, missing keys, inconsistent files, or unclear business rules require a separate quote.
Will I receive an editable file?
Yes. You will receive an editable Power BI Desktop PBIX file and the additional deliverables listed in your selected package.
What is considered a revision?
A revision corrects an agreed item within the original scope. New sources, pages, KPIs, calculation rules, or integrations require a new quote.