Browse categories
English
$
USD
Connect to your AI

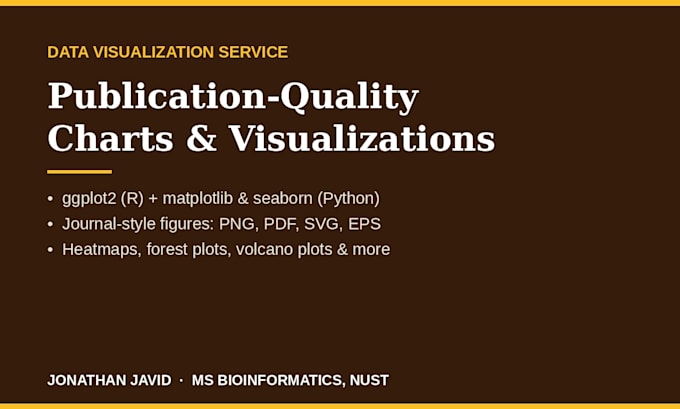
Your data deserves better than default Excel charts. I will turn your spreadsheet into clear, publication-ready visualizations that reviewers, managers and readers actually understand.
I am a bioinformatics researcher (MS, NUST) and health data analyst. Data visualization is core to my published work: 3 peer-reviewed papers, figures for a 62,582-variant genomic benchmark, and statistical dashboards for health insurance operations at State Life Insurance Corporation. I work in R (ggplot2) and Python (matplotlib, seaborn), with Tableau available on request.
WHAT YOU GET
- The right chart for your data and message: bar, line, scatter, box, violin, heatmap, forest plots, volcano plots and more
- Clean, consistent styling: fonts, colours and labels matched across every figure
- Journal-ready output in PNG, PDF and (Premium) editable SVG/EPS at print resolution
- Honest advice if a chart type would mislead I will suggest a better one instead of just drawing it
Send your data as Excel or CSV. Message me before ordering if you need a full dashboard or an unusual format, and I will quote honestly.
Bioinformatics Researcher, Variant Interpretation, Python, R, Machine Learning
Languages
Which tools do you use?
R (ggplot2) and Python (matplotlib, seaborn) mainly; Tableau for dashboard-style work on request.
What formats do I receive?
Publication-ready PNG and PDF in every package; editable SVG/EPS plus the commented script in Premium.
Can you match a specific journal's figure style?
Yes — send the journal's author/figure guidelines with your order.
Can you recreate and improve a chart I already have?
Yes — send the chart and its source data, or the chart alone for a redraw quote.
Is my data confidential?
Completely. Used only for your order, never shared.
