Browse categories
Explore
Fiverr Pro
English
$
USD


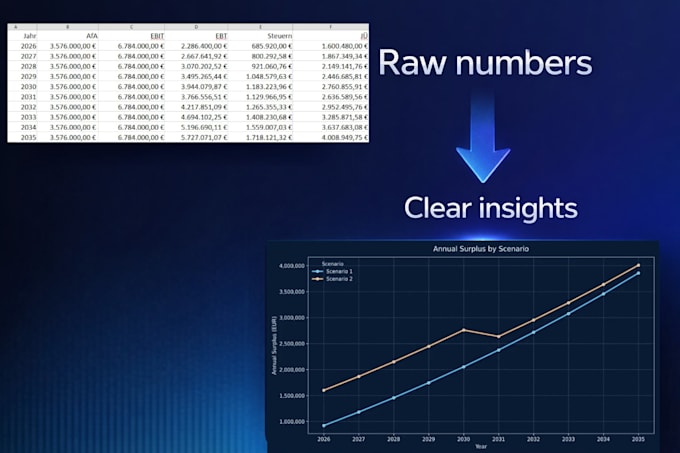
Do you have data but no idea how to present it? I'll turn your raw numbers into clean, professional charts and graphs that actually tell a story.
I work with CSV, Excel, JSON, or any structured data you provide and build visualizations using Python (Matplotlib, Seaborn, Plotly), Excel or others. Whether it's for a report, a presentation, or internal analysis I make sure the output is clear, accurate, and looks great.
What I need from you:
What you get:
Not sure what kind of chart fits your data? Just describe your goal I'll figure out the best format.
Software Automation
Languages