Browse categories
Explore
Fiverr Pro
English
$
USD
My services include:
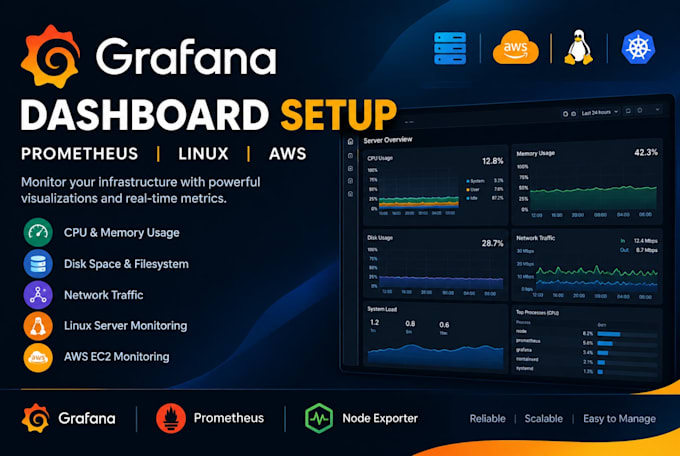
I focus on clean, practical dashboards that help you understand server performance and identify resource issues.
Technologies: Grafana, Prometheus, Node Exporter, Linux, Docker, and AWS EC2.
Please contact me before ordering if you need Kubernetes monitoring, multiple servers, custom metrics, or advanced alerting. I'll confirm your requirements and the package scope before starting.


Operating system:
Linux
What do you need from me to get started?
Please provide your server operating system, number of servers, monitoring requirements, and details of your existing Grafana or Prometheus setup. We can agree on secure access if required.
Can you set up monitoring on AWS EC2?
Yes. I can configure Grafana monitoring for AWS EC2 instances within the selected package's scope.
Do you support Linux VPS monitoring?
Yes. I can help configure monitoring for Linux servers hosted on VPS providers, provided the server meets the necessary requirements.
Can you monitor Docker containers?
Yes, depending on your requirements and existing monitoring setup. Please contact me before ordering so I can confirm the required configuration.
Do you support Kubernetes monitoring?
Kubernetes monitoring depends on your cluster architecture and requirements. Please contact me before ordering to discuss the scope and complexity.
Can you configure alerts?
Basic alert configuration is available in the Premium package. Advanced alert routing, notification integrations, and automated remediation require separate discussion.
Can you customize the dashboard?
Yes. I can customize dashboard panels and visualizations based on your monitoring requirements and the metrics available from your infrastructure.
Can you work with an existing Grafana and Prometheus installation?
Yes. I can integrate with an existing setup, provided it is accessible and compatible with the requested configuration.
Will you guarantee that every metric is available?
Metric availability depends on your operating system, exporters, permissions, and infrastructure. I'll verify the agreed metrics and explain any limitations.
Should I contact you before placing an order?
Please contact me first for Kubernetes monitoring, multiple servers, custom exporters, advanced alerting, or a new monitoring stack. This helps ensure you select the correct package.