I will turn your data into professional charts, graphs, and presentation

K
kaushik_mysur
K
kaushik_mysur
Kaushik

About this gig

Turn your Excel data into clear, professional charts and presentations.

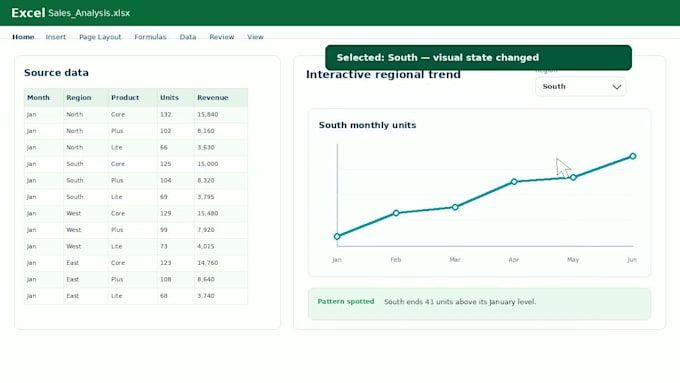
Have valuable information in a spreadsheet but struggle to present it clearly? I create accurate, editable Excel charts that make trends, comparisons, patterns, and key findings easier to understand.


I can help you:

  • Compare sales, costs, products, or performance metrics
  • Visualize trends, proportions, distributions, and relationships
  • Choose suitable charts with clear titles, axes, labels, and consistent styling
  • Match your preferred colors or reference design
  • Verify plotted values against your source data


What you'll receive:

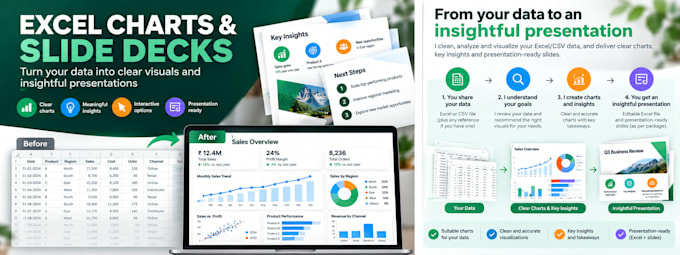
A professionally formatted Excel workbook with editable charts. Image exports can be included when agreed. Standard and Premium packages also include a concise PowerPoint presentation; Premium adds deeper data-supported highlights and observations.


To get started:

Upload your Excel/CSV file and describe what you want the charts to communicate. A sample or style reference is helpful but optional.

For dashboards, external data connections, or extensive analysis, please message me for a custom offer.

Get to know Kaushik

Kaushik

Data Processing and Python Automation

  • FromIndia
  • Member sinceOct 2026
  • Languages

    English
I help businesses solve practical problems through data processing, visualization, and Python automation. My services include data cleaning and validation, Excel charts and reporting, and automation of repetitive business and technical workflows. I start by understanding your problem and desired outcome, then define requirements and build an appropriate solution. My approach emphasizes clear business rules, reliable execution, careful exception handling, AI-assisted testing, and independent verification. I deliver dependable solutions that address real business needs.