Browse categories
English
$
USD
Connect to your AI

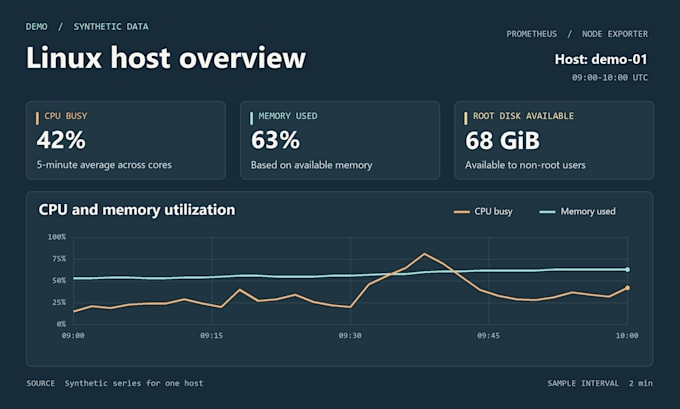
If Prometheus already collects Linux metrics but your Grafana panels show empty graphs, misleading percentages or every mount point at once, I can build a dashboard around the metrics and labels you actually have.
You receive one importable Grafana dashboard JSON, the PromQL behind the panels and instructions for selecting your existing Prometheus data source. We agree on the views first. Typical choices include CPU busy percentage, memory available, disk space by mount and network traffic by interface. I adapt filters to your job and instance labels so you can compare hosts.
Choose up to 3, 6 or 10 panels. Every package includes one revision for the agreed dashboard. Your Linux hosts should already expose metrics through node_exporter and Prometheus. If you are unsure about a metric, message me on Fiverr with its name, your Grafana version and a sanitized label example. No production login is needed.
Shopify catalog cleanup and Matrixify file preparation
Languages
What if my labels differ from a standard Linux dashboard?
Send a sample metric line with the labels anonymized. I use the actual label names and mount or interface structure in your queries and dashboard filters.
Does this include installing Prometheus or node_exporter?
This service starts with an existing Grafana and Prometheus setup that already receives Linux metrics. I deliver the dashboard file, queries and import steps. You can message me on Fiverr first if you are unsure what data is available.